Project Summary
This monthly global drought severity index (DSI) dataset is developed solely from satellite observed time-variable terrestrial water storage (TWS) changes from the Gravity Recovery and Climate Experiment (GRACE). The GRACE-DSI record spans from 2002 until now, and will be extended with the ongoing GRACE and scheduled GRACE Follow-On missions. The GRACE-DSI provides globally continuous drought monitoring for the entire terrestrial hydrologic cycle (i.e. snow, surface water, soil moisture, and groundwater). The index shows favorable agreement with traditional drought monitoring tools including the United States Drought Monitor (USDM), Palmer DSI (PDSI), standardized precipitation and evapotranspiration index (SPEI), satellite-derived normalized vegetation difference index (NDVI) as well as surface soil moisture estimates, and in-situ groundwater observations. The GRACE-DSI has well-characterized uncertainty which can facilitate the incorporation of the index into decision making and operational applications.
Funding
This work was performed at the UC Irvine, Dep. Earth System Science under a contract with the National Aeronautics and Space Administration (NASA)’ Hydrology Program (Entin Jared, Program Manager), Grant NNX15AB62G and NNX16AN05G
Highlights
The GRACE-DSI is observation-based and enables drought feature comparison across space and time at broad scales, but without many of the constraints of more traditional drought monitoring methods.
The GRACE-DSI complements existing drought monitoring datasets such as the PDSI by providing information about deeper water storage changes, which affect soil moisture recharge and drought recovery.
The GRACE-DSI integrates moisture variations from the plant root zone and thus provides new insights into understanding plant-water relations at broad scales.
We provide a comprehensive estimate of GRACE-DSI uncertainty. In addition, the GRACE-DSI does not require the scaling of GRACE signals.
Please Cite the paper below when using the GRACE-DSI dataset
 Zhao, M., G. A., I. Velicogna, and J. S. Kimball, 2017: A global gridded dataset of GRACE drought severity index for 2002-2014: Comparison with PDSI and SPEI and a case study of the Australia Millennium drought. J. Hydrometeorol., 18, 2117-2129, DOI: https://doi.org/10.1175/JHM-D-16-0182.1
1. Definition of GRACE-DSI
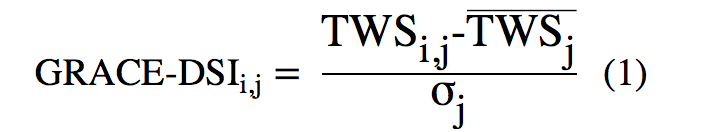
The GRACE-DSI is defined as the standardized anomalies of GRACE TWS as follows:
where i is year ranging from 2002 until now, j is month ranging from January to December,
and σ
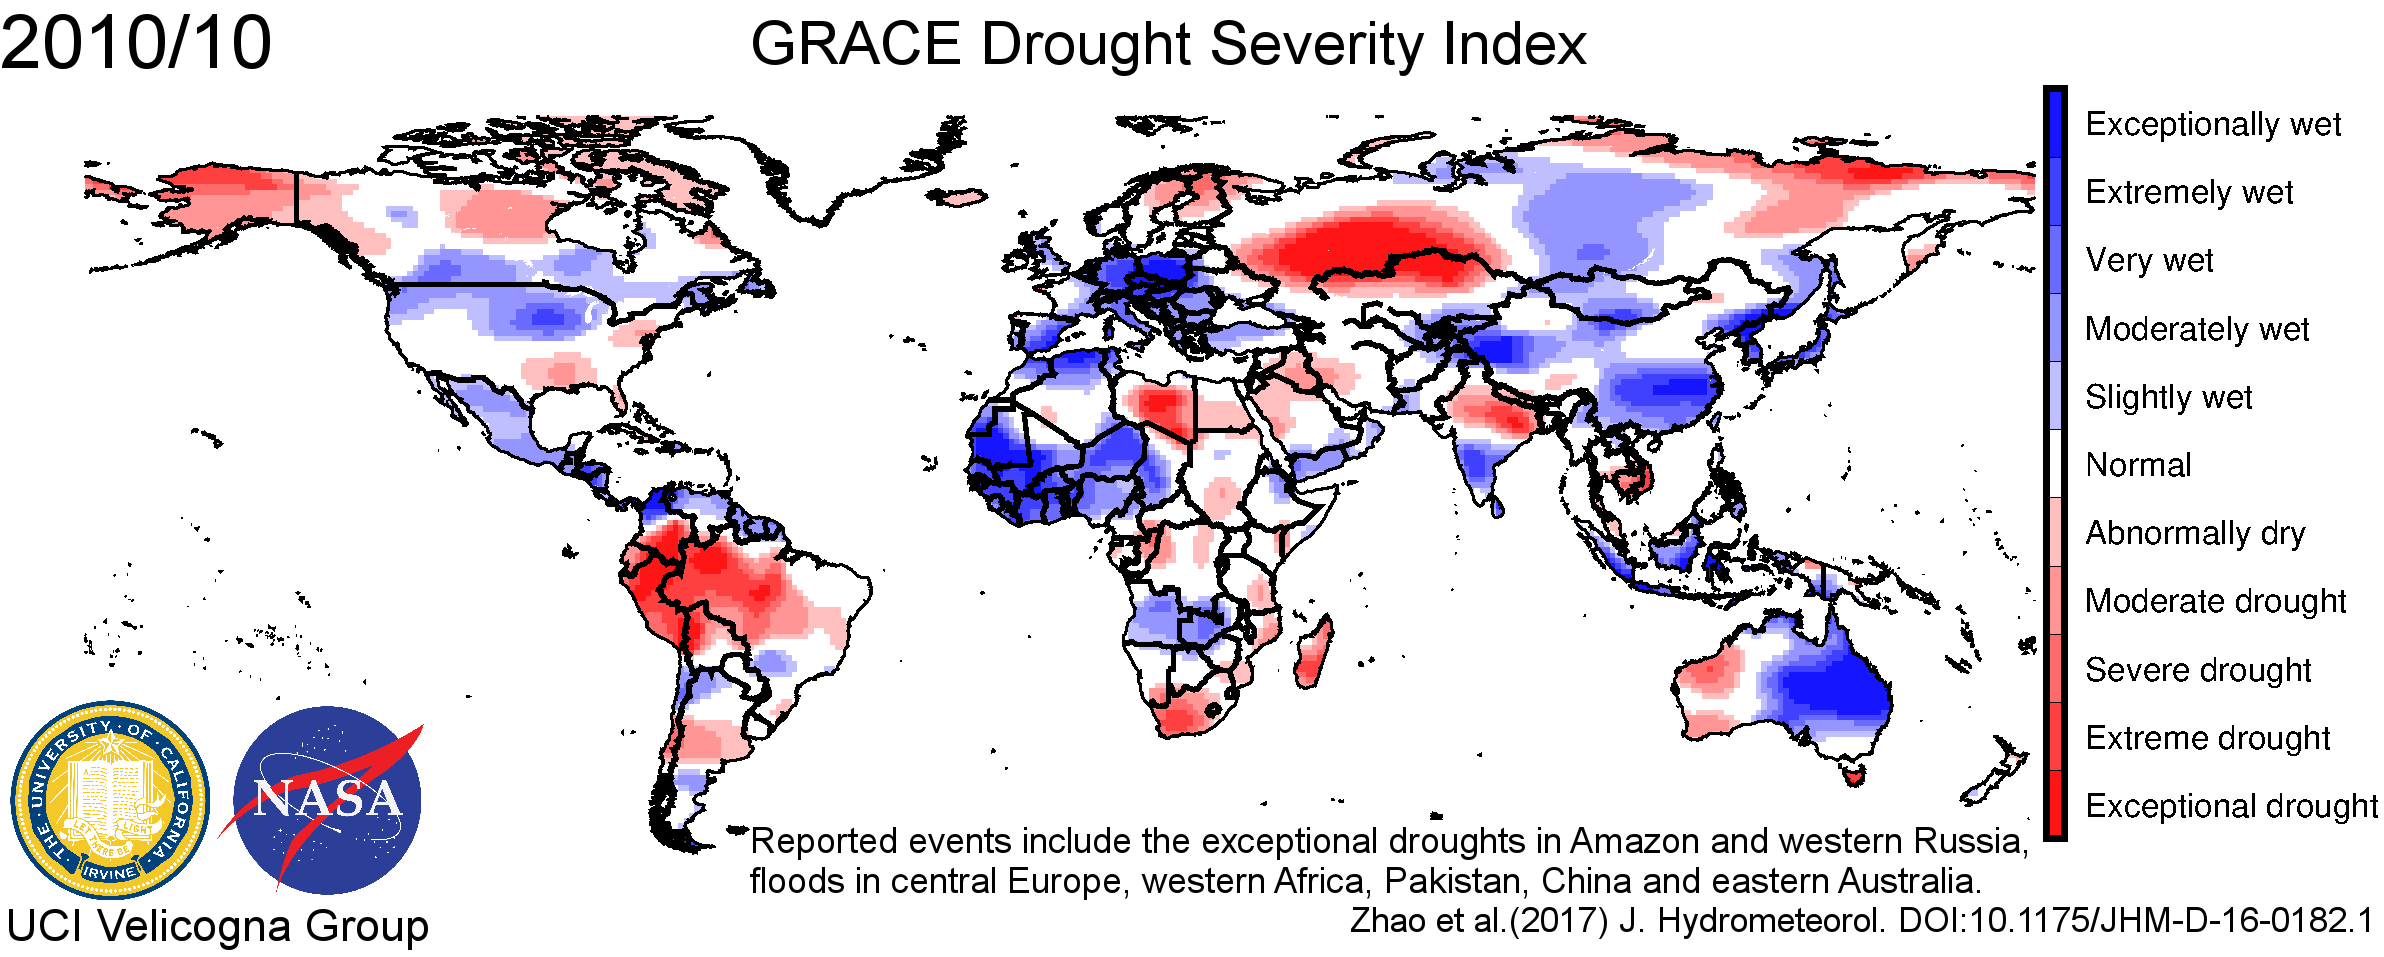
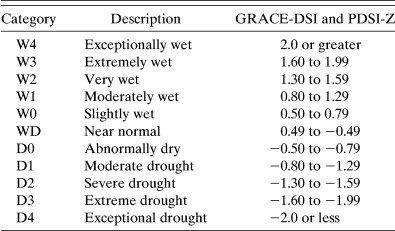
j are the mean and standard deviation of TWS anomalies in month j, respectively. The GRACE-DSI is a dimensionless quantity that detects both drought and abnormally wet events. The values of GRACE-DSI are classified into 11 categories detailed in the table below.
2. Why do we need standardization in GRACE-DSI?
Drought monitoring and studies based on standardized drought indices can faciliate the transferring of successful drought mitigation strategies among different regions. The GRACE-DSI differs from
Thomas et al. (2014) and other indices using GRACE alone because it is a standardized drought index that accounts for the regional variability in TWS that directly affects the characterization of drought. Fig. 3 shows the spatial distribution of the maximum TWS deficit for each USDM-classified drought category during 2011–12 and the corresponding monthly TWS standard deviation. We find that it takes a larger TWS deficit to reach the same USDM-classified drought category in the East, where the climate is humid and the TWS variability is large, than in the West where the climate is drier and the TWS variability is small.
Fig. 3. (a)–(d) The maximum TWS deficit observed in regions where D1–D4 drought, respectively, has been reported by the USDM in 2011. (e)–(h) The TWS standard deviation for the calendar month when the maximum TWS deficit is observed in 2011, as seen in (a)–(d). (i)–(l) As in (a)–(d), but for 2012. (m)–(p) As in (e)–(h), but for 2012.
The GRACE-DSI complements the PDSI by providing drought information in the deeper soil layer. The time scale at which the SPEI achieves maximum temporal correlation with the GRACE-DSI (optimal time scale) is of potential use to constrain the relative depth of the water component that dominates the overall changes in the water cycle at a specific location.
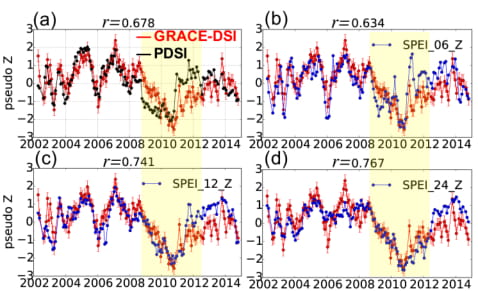
Fig. 4. Inter-comparison of drought indices time series in western Russia. (a) is GRACE-DSI (red) and PDSI (black). (b-d) are GRACE-DSI with SPEI (blue) at 6, 12, and 24-month time scales, respectively. Yellow-shaded period highlights the evolution of the 2010 drought. Person correlation coefficient of each comparison is shown on top of each plot. Error bars on GRACE-DSI represent the GRACE-DSI uncertainty due to GRACE measurement and leakage errors. No error estimate is available for PDSI and SPEI.
The GRACE-DSI has a quantified uncertainty that facilitates its incorporation into decision making and operational applications. Similar uncertainty analyses are not seen in traditional drought monitoring tools such as the PDSI and SPEI.