Overview of the 2014 fire season severity (FSS) prediction
This webpage presents a prediction of fire risk for the 2014 dry season in high biomass burning regions of South America. The following figure presents fire season severity indices (FSSI, ranging from 0-100) for 6 states in Brazil (Acre, Amazonas, Maranhao, Mato Grosso, Para, and Rondonia), 3 departments in Bolivia (El Beni, Pando, and Santa Cruz), and one country (Peru) using sea surface temperature information through the end of May. Green indicates below average predictions of fire activity whereas orange and red indicate above average activity. The 2014 fire season is predicted to be below average across the southern Amazon, based on cool sea surface temperatures (SSTs) in the tropical Atlantic and Pacific oceans at the end of the Amazon wet season. Projected FSS is close to the 25th percentile in all regions, relative to the long term mean FSS. A detailed description of the prediction method is given here.
FSS predictions compared to observations
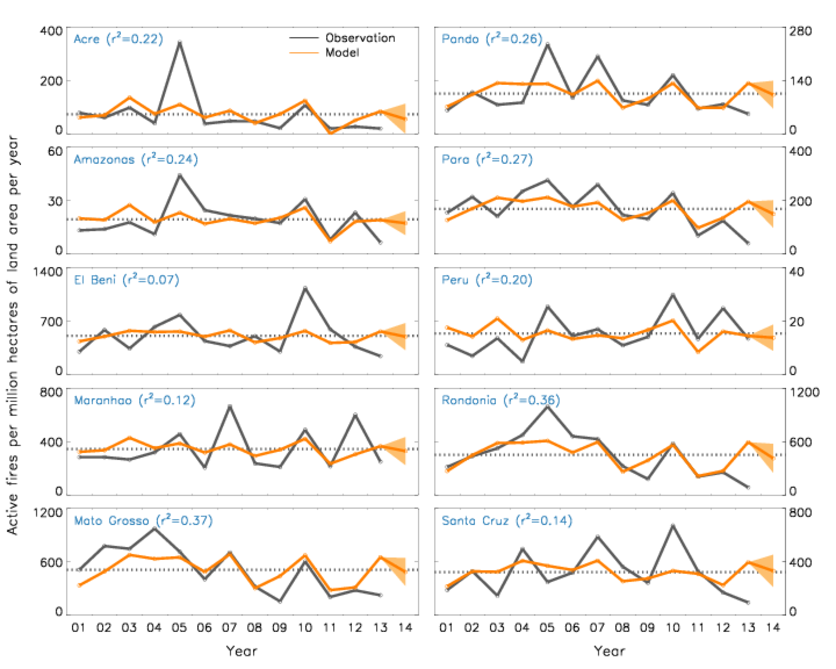
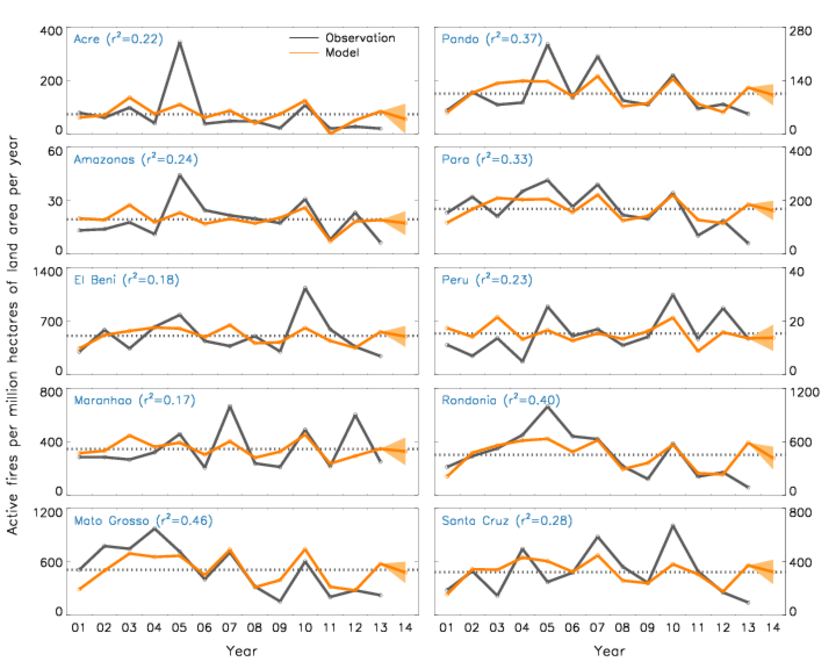
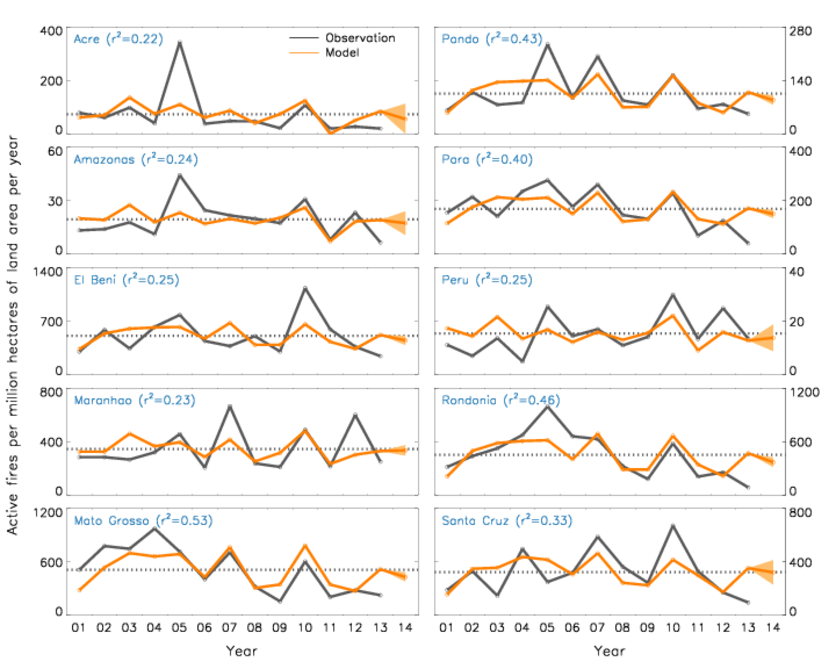
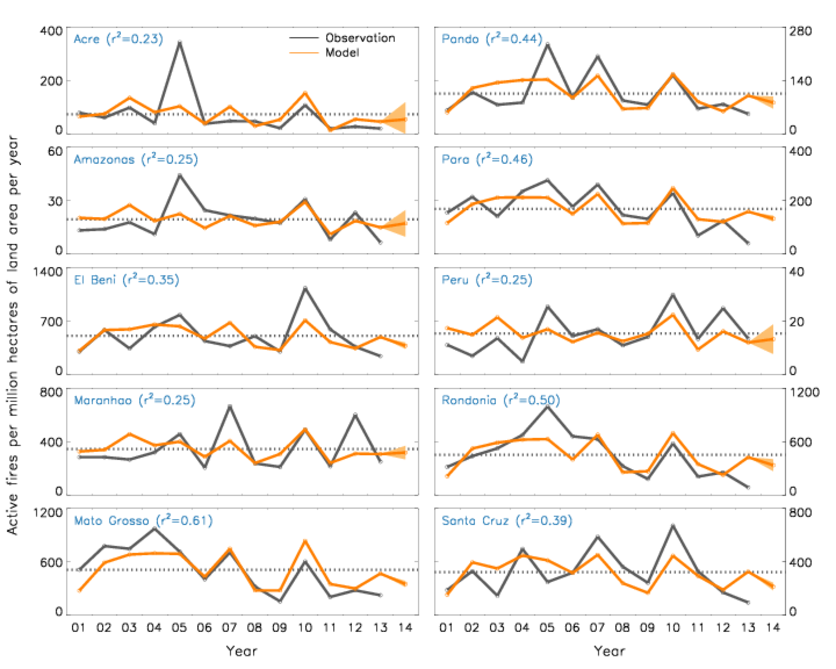
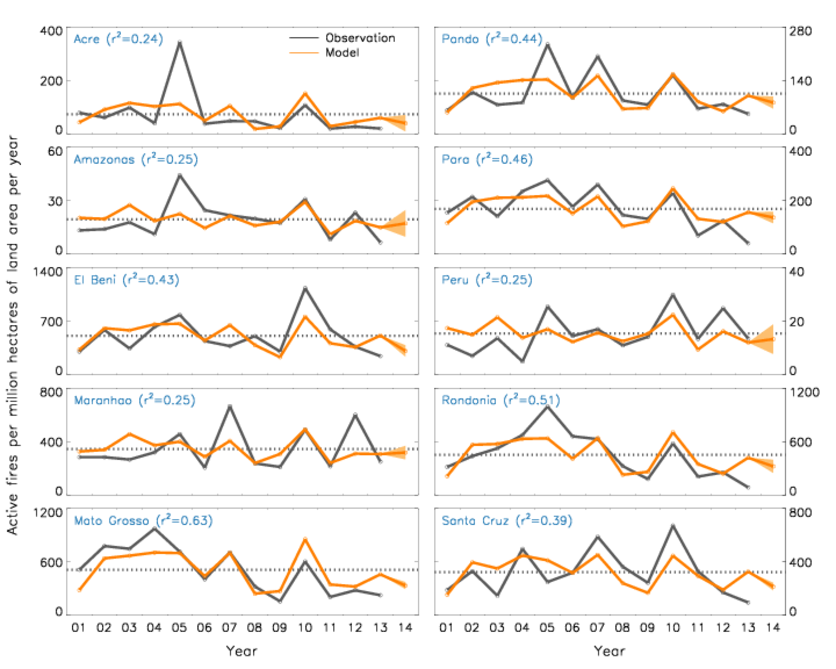
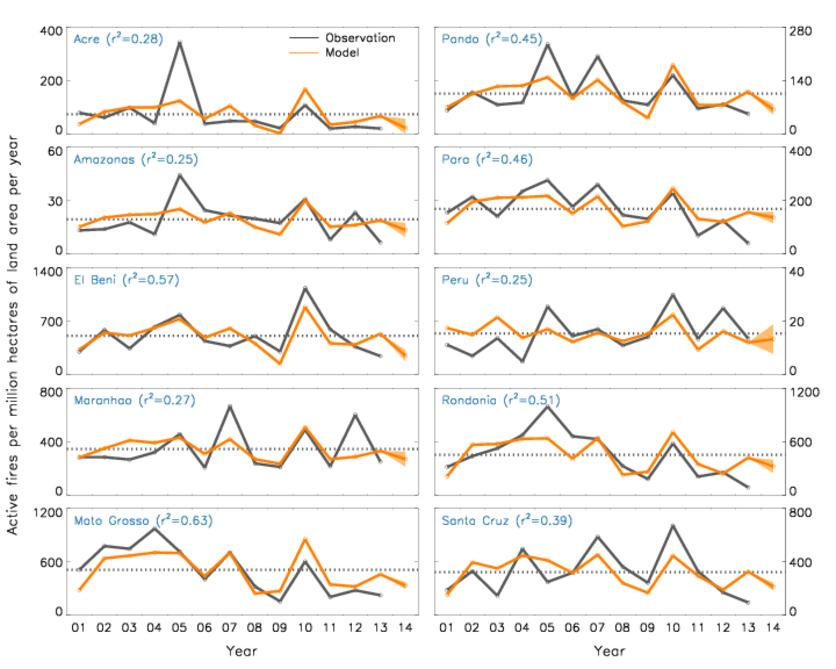
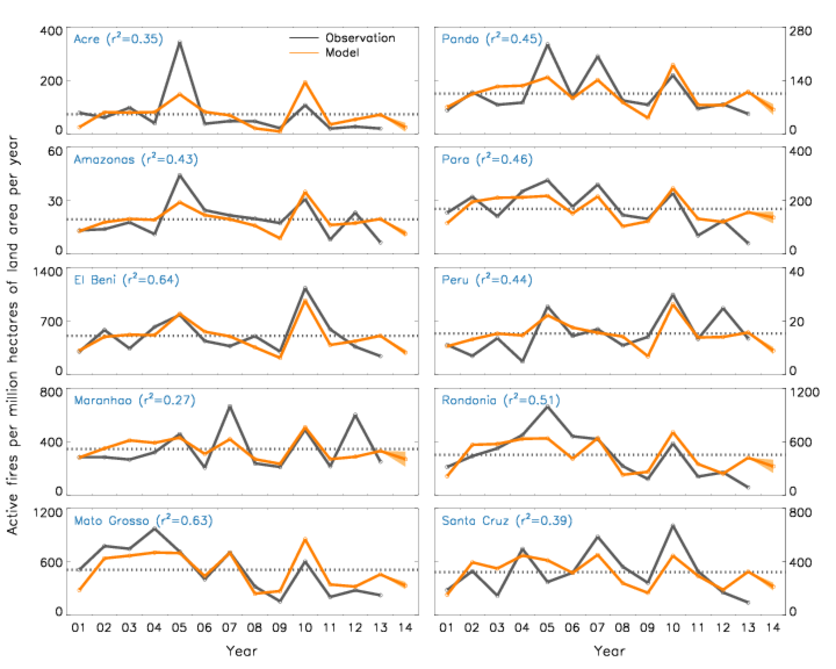
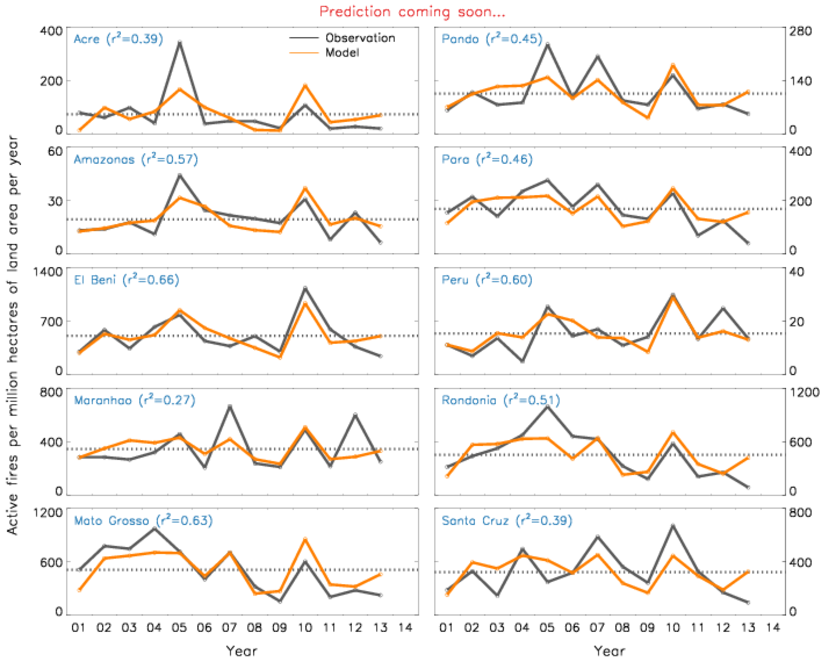
This figure compares the observed and modeled FSS in South America fire regions. The black solid lines are observations for past years, and the black dashed horizontal lines represent the all year mean observed values. The orange lines are FSS derived from the empirical model. The orange shades indicate the range of predicted FSS in 2014 for each region. The numbers in the parentheses represent the coefficient of determination (r2). Information on sea surface temperatures through May of 2014 were evaluated for these predictions. Click the boxes below the figure to see previous predicitons using earlier data.
FSS is the sum of active fire counts (FC) during the fire season. Active fires are the thermal radiation anomalies created by fires that are detected by satellites. Our empirical model was based on active fire observations from Moderate Resolution Imaging Spectroradiometer (MODIS) on board the NASA Terra satellite.
Maps of monthly active fires as observed by MODIS in South America. Click "<" or ">" for active fire data in previous or next year/month. Click "Enable/Disable smoothing" to see the location of each observed fire. (Note: To view the content below, you may need to enable the browser to load scripts from unauthenticated sources)
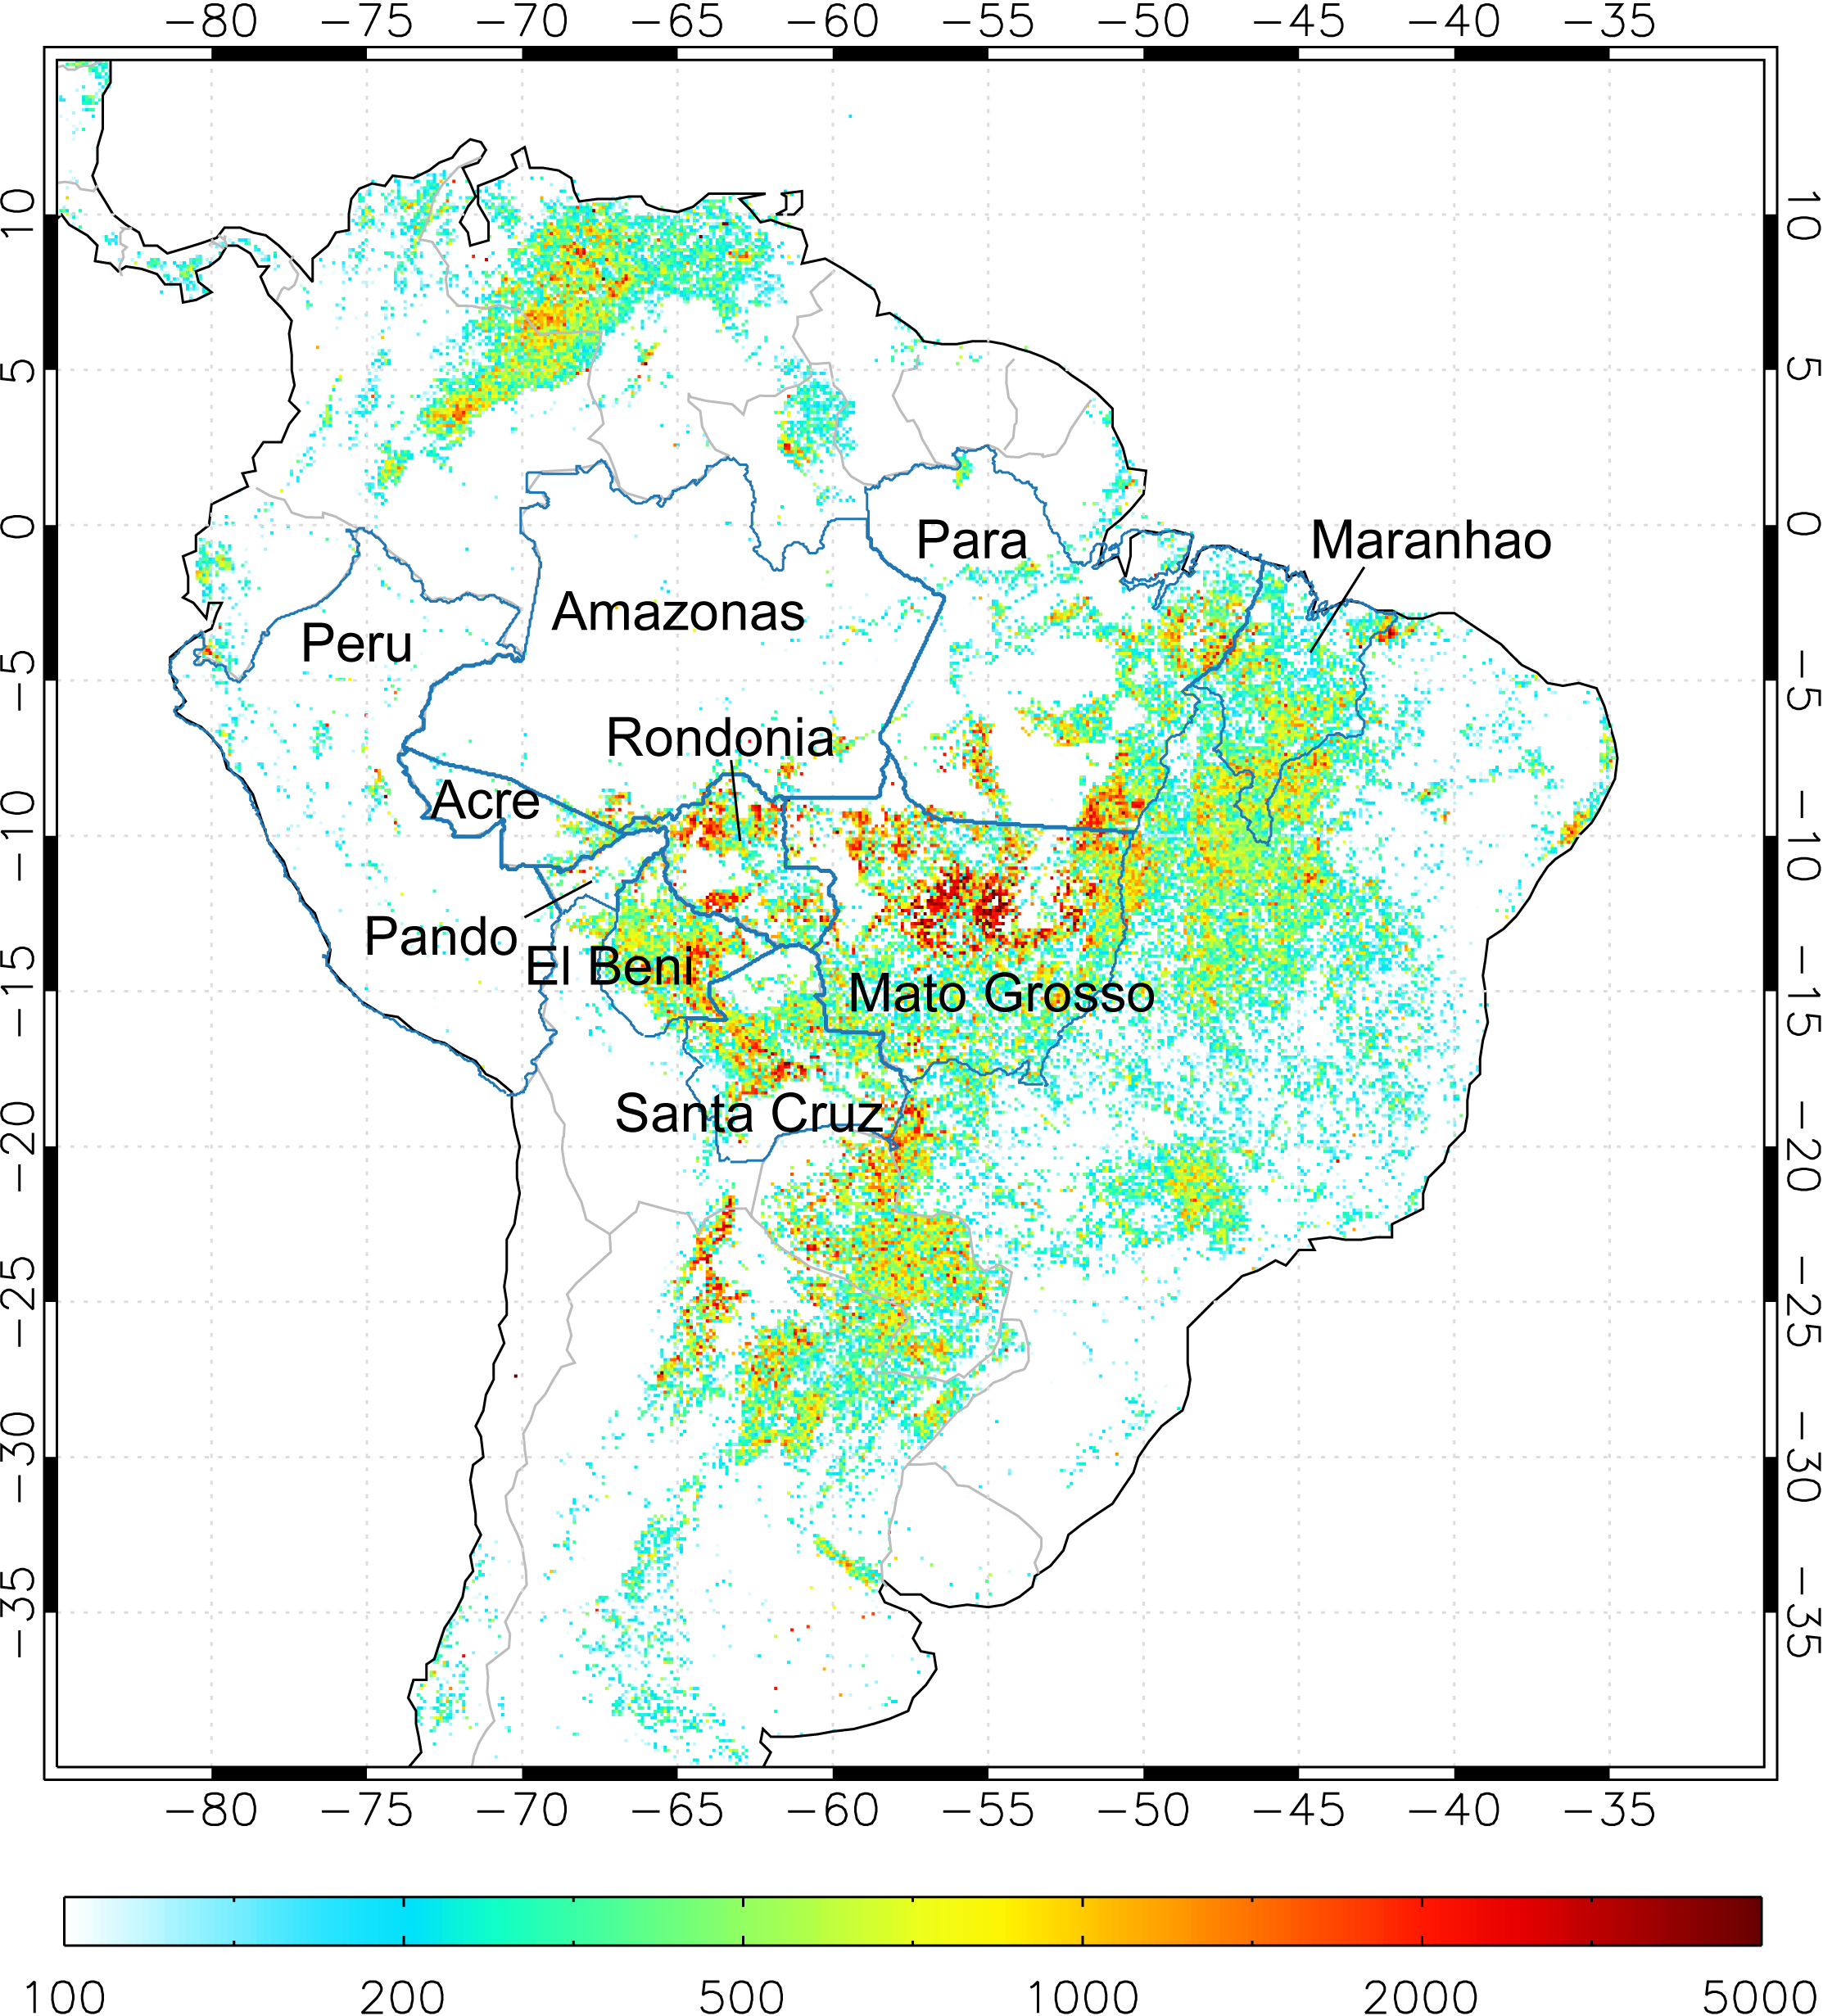
A map of FC density (in numbers per million hectares per year) averaged over 2001-2013. The location of 10 geographical regions considered in this study is marked. Click on the map for a larger version.
Fraction of active fire counts in each region (among the 10 regions considered in this study). Move to pointer over each wedge to see the mean annual active fire counts in each region.
Time series of total FC (in numbers per month) in the 10 regions of South America since 2000.
Ocean climate indices
To predict FSS in South America, we used two climate indices that represent the sea surface temperature anomalies in Pacific and Atlantic: ONI (Ocean Nino Index) and AMO (Atlantic Multidecadel Oscillation index). The following figure shows time series of ONI and AMO since 2000.
Relationship between ocean climate indices and FSS
Linear regression analyses show that the annual FSS had largest correlation with ONI and AMO during months between October previous year and April. Here we show the monthly ONI and AMO values during this time period for eath year. The colors from dark blue to dark red represent the order of lowest to highest fire years.
The following figure compares interannual variations of sea surface temperatures and fire season severity in South America. The upper panel shows the time series of mean ONI and AMO anomalies averaged over the period from October (previous year) and April (current year). The anomalies are relatave to the 2001-2010 mean. The bottom panel shows the time series of annual FSS.
Terrestrial water storage
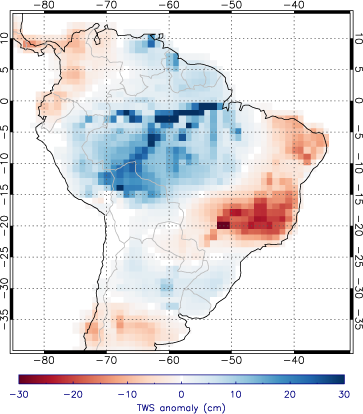
NASA's Gravity Recovery and Climate Experiment(GRACE) satellite shows above average terrestrial water storage (TWS) over most Amazonia region in March 2014, indicating a large rate of soil moisture recharging during the wet season. High TWS suggests that trees can access sufficient moisture through deep rooting and are likely more resistent to fires in the upcoming dry season. This is consistent with our SST-based forecast for below average fire activity this year.
References
Chen, Y., J. T. Randerson, D. C. Morton, R. S. DeFries, G. J. Collatz, P. S. Kasibhatla, L. Giglio, Y. Jin, M. E. Marlier, Forecasting fire season severity in South America using sea surface temperature anomalies, Science, 334, 787-791, 2011. [link]
Chen Y., I. Velicogna, J. S. Famiglietti, and J. T. Randerson, Satellite observations of terrestrial water storage provide early warning information about drought and fire season severity in the Amazon, J. Geophys. Res. - Biogeosciences, 118, 1-10, 2013. [link]
Chen, Y., J. T. Randerson, D. C. Morton, Y. Jin, G. J. Collatz, P. S. Kasibhatla, G. R. van der Werf, R. S. DeFries, Long-term trends and interannual variability of forest, savanna and agricultural fires in South America, Carbon Management. 4(6), 617-638. [link]
Glossary
FC : Active fire counts, defined as the number of fire/hotspots observed by satellite.
AMO: Atlantic Multi-decadal Ossilation index, representing sea surface temperature anomaly in North Atlantic. We used 3-month mean of Kalplan SST anomalies in North Atlantic (0-70N). Data available at NOAA Earth System Research Laboratory website.
Fire season: The fire season is defined here as the period from 4 months before the peak fire month to 4 months after the peak fire month.
FSS: Fire season severity, defined as the sum of FC during the fire season (4 months before the peak fire month to 4 months after the peak fire month) for each year.
FSSI: FSS index, a measure of FSS based on historical mean values and standard deviation in the same region. FSSI = 50*(1+ERF((FSS-FSSoavg)/sqrt(2)/FSSostd), where FSSoavg and FSSostd are mean and standard deviation of observed FSS during 2001-2010. ERF is the error function.
MODIS: Moderate Resolution Imaging Spectroradiometer, an earth observation remote sensing instrument on board the Terra satellite and Aqua satellite.
ONI: Ocean Nino Index, representing sea surface temperature anomaly in Eastern tropical Pacific. We used 3-month mean of ERSST.v3b SST anomalies in the Niño 3.4 region (5N-5S, 120-170W). Data available at NOAA Climate Prediction Center website.
Terra: A NASA research satellite in a sun-synchronous orbit around the earth. It carries a payload of five remote sensors including MODIS.
Acknowledgements
This work is funded by the Gordon and Betty Moore Foundation through Grant GBMF3269 and the US Agency for International Development (USAID).
This work is the result of a collaboration between University of California, Irvine (Yang Chen and Jim Randerson), NASA Goddard Space Flight Center (Doug Morton and James Collatz), Columbia Univeristy (Ruth DeFries and Miriam Marlier), University of Maryland (Louis Giglio), and Duke University (Prasad Kasibhatla).
NASA provided the satellite observations of fires and NOAA provided the sea surface temperature time series used in our analysis. The interactive figures and maps were generated using Google's Chart API , Maps API, and Fusion table API .
Adriana Lucia Romero Olivares at UC Irvine translated this forecast website to Spanish.
Disclaimer
The model predictions contained on this website are highly experimental. They cannot be used to predict the occurrence of individual fires. Use of this information for planning purposes should also draw upon other independent and reliable climate information sources. The Regents of The University of California will not be liable for any consequences that may occur if you rely on this information.