Prediction of fire season severity in South America — 2012
Overview of the 2012 fire season severity (FSS) prediction
This webpage presents the prediction of 2012 fire season severity (FSS) in high biomass burning regions of South America using sea surface temperatures in Pacific and Atlantic oceans. The following gauges present the latest predicted 2012 fire season severity index (FSSI, ranging from 0-100) for 6 states in Brazil (Acre, Amazonas, Maranhao, Mato Grosso, Para, Rondonia), 3 departments in Bolivia (El Beni, Pando, Santa Cruz), and one country (Peru). Green indicates below average predictions of fire activity whereas orange and red indicate above average activity. Across Southern Hemisphere South America, the severity of the 2012 fire season is predicted to be below average or average because of strong La Nina conditions in the Pacific and below average sea surface temperatures in the North Atlantic. A detailed description of the prediction method is given here.
FSS predictions compared to observations
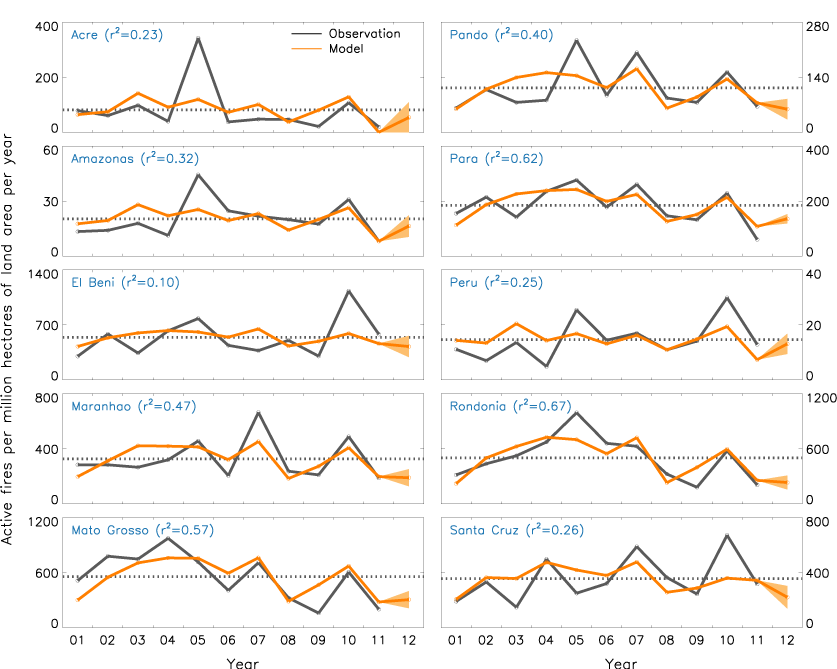
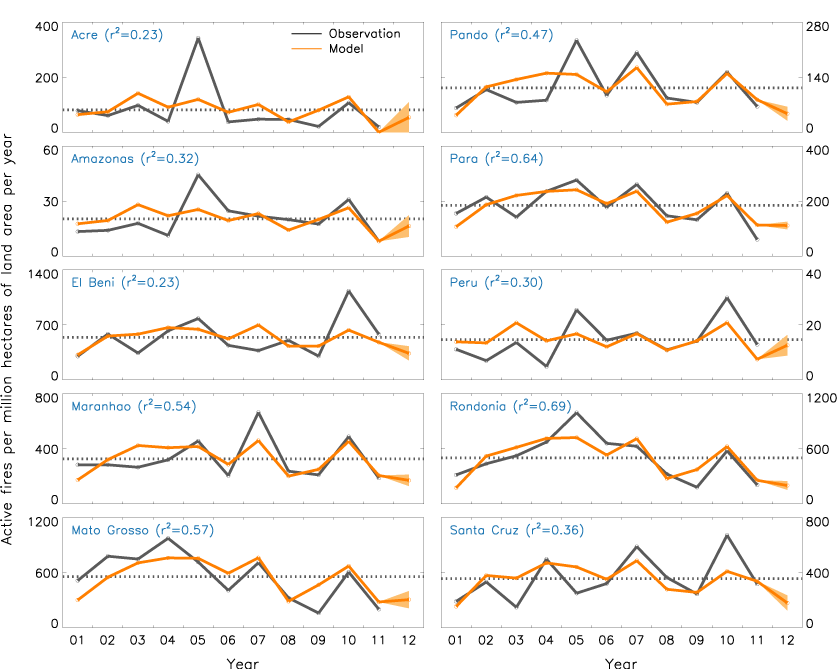
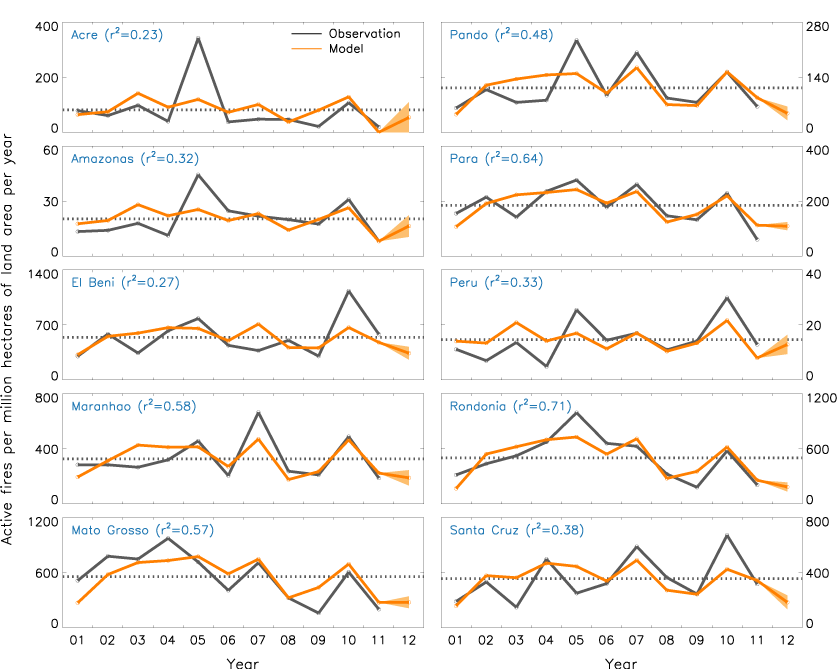
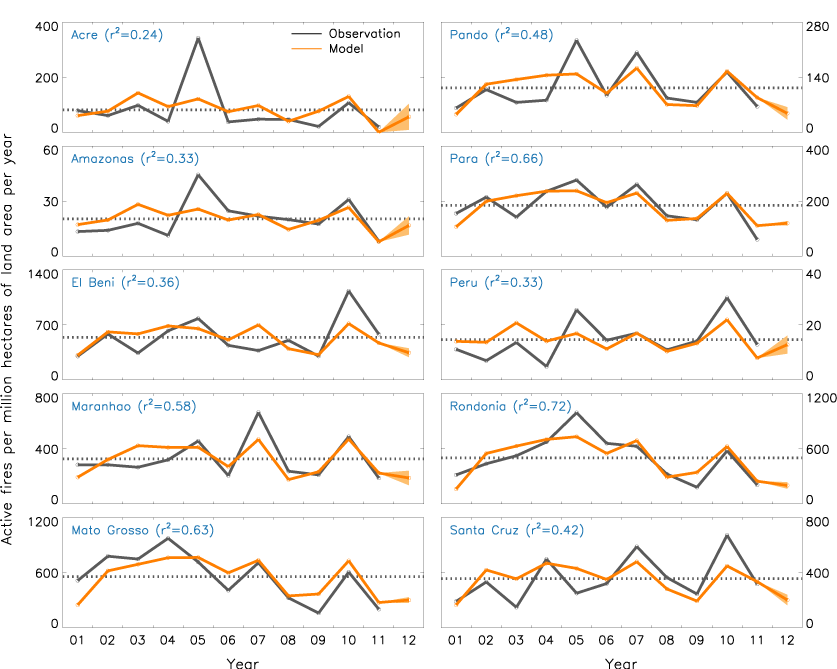
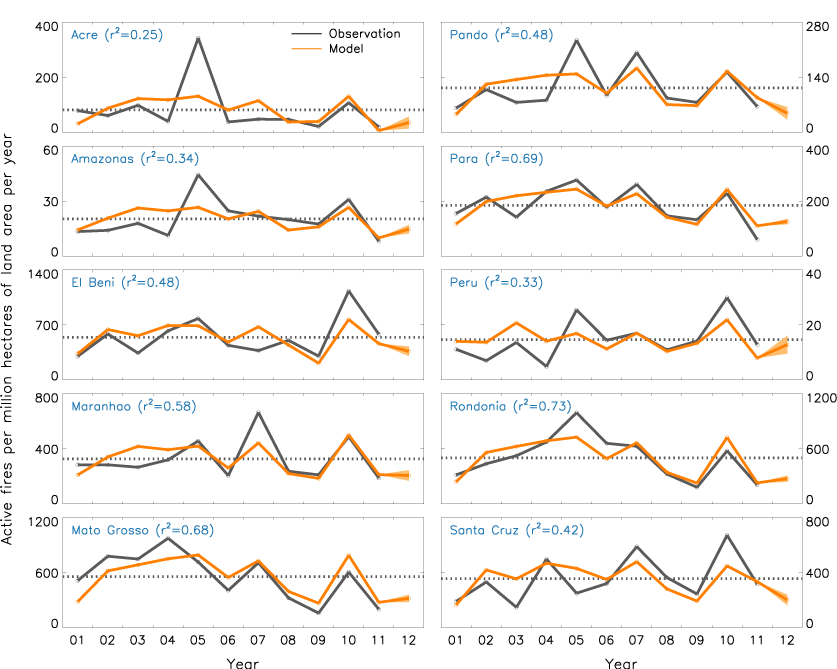
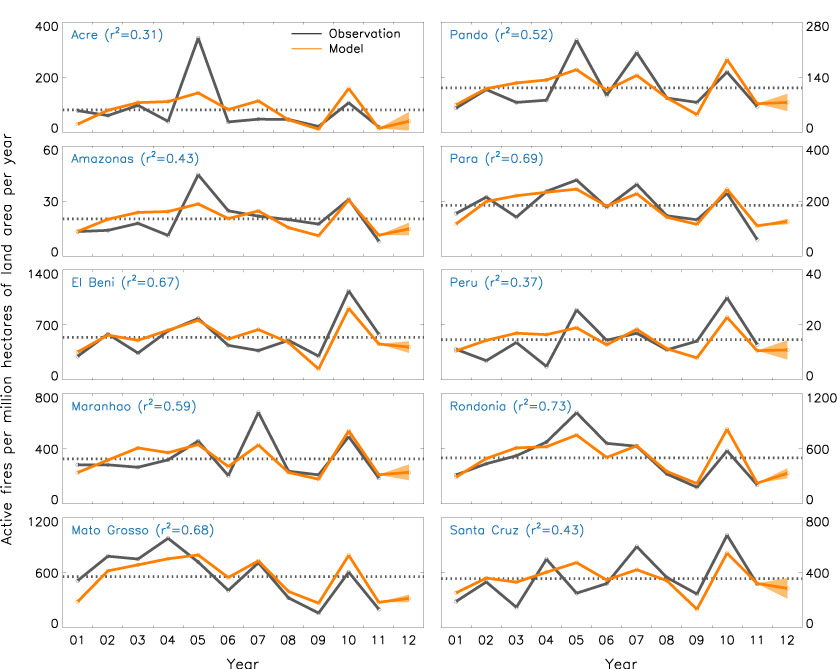
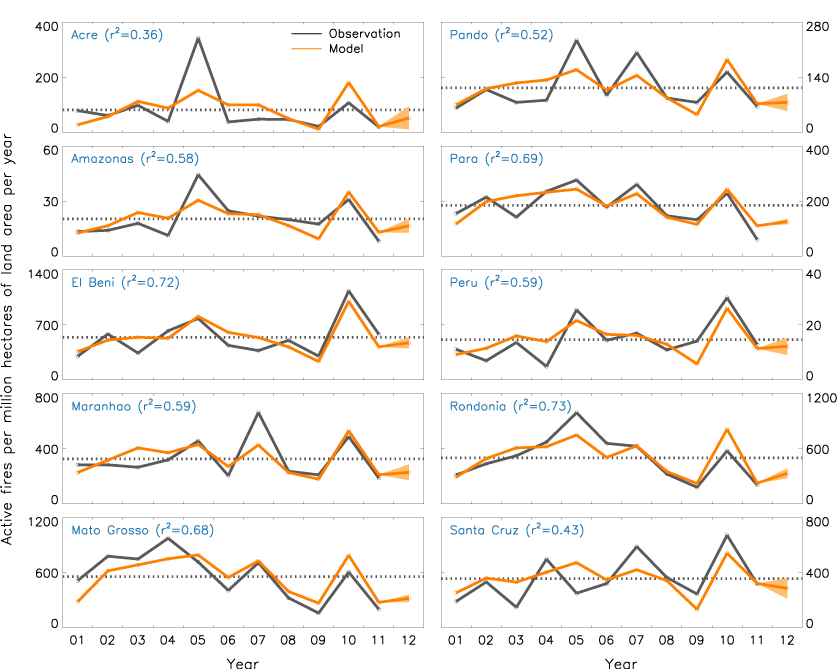
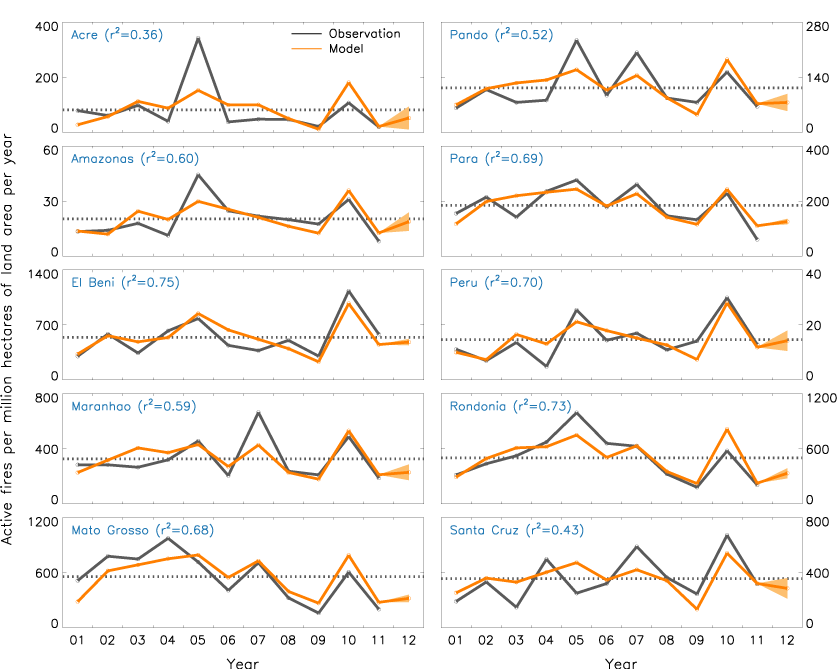
This figure compares the observed and modeled FSS in South America fire regions. The black solid lines are observations for past years, and the black dashed horizontal lines represent the all year mean observed values. The orange lines are FSS derived from the empirical model. The orange shades indicate the range of predicted FSS in 2012 for each region. The numbers in the parentheses represent the coefficient of determination (r2). Information on sea surface temperatures through June of 2012 were evaluated for these predictions. Click the boxes below the figure to see previous predicitons using earlier data.
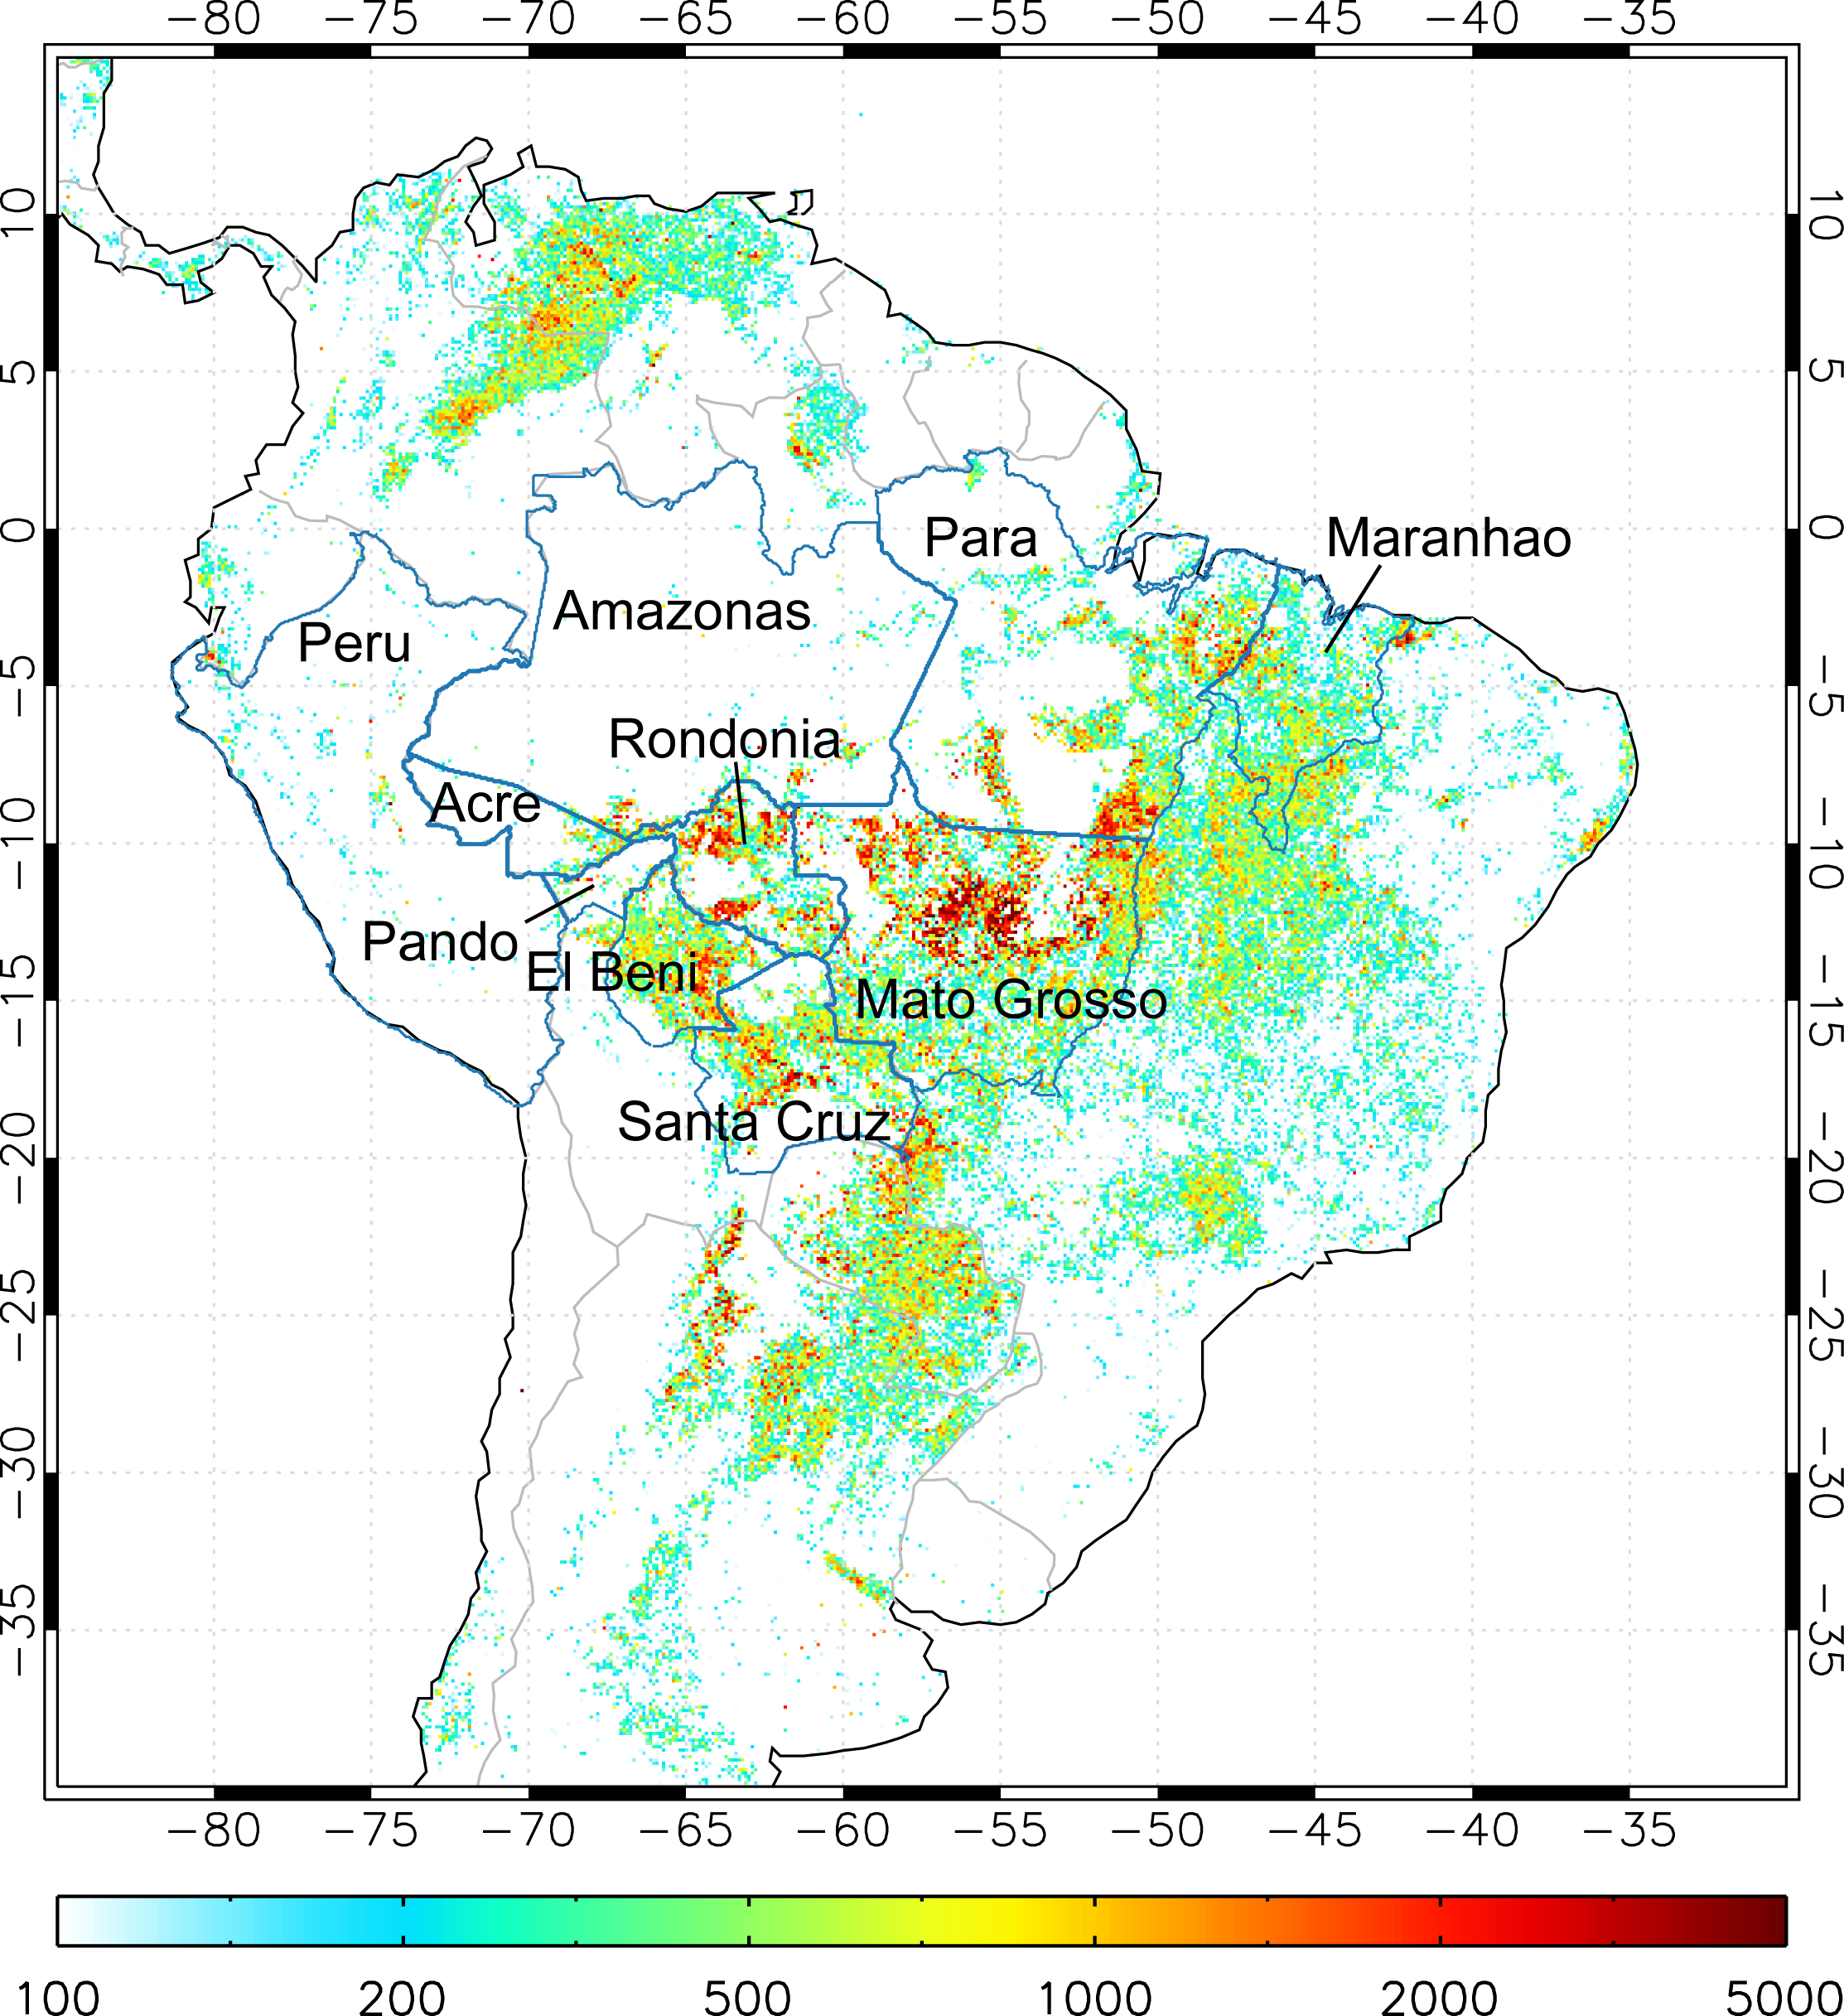
Satellite observation of active fires
FSS is the sum of active fire counts (FC) during the fire season. Active fires are the thermal radiation anomalies created by fires that are detected by satellites. Our empirical model was based on active fire observations from Moderate Resolution Imaging Spectroradiometer (MODIS) on board the NASA Terra satellite.
Ocean climate indices
To predict FSS in South America, we used two climate indices that represent the sea surface temperature anomalies in Pacific and Atlantic: ONI (Ocean Nino Index) and AMO (Atlantic Multidecadel Oscillation index). The following figure shows time series of ONI and AMO since 2000.
Relationship between ocean climate indices and FSS
References
Glossary
Acknowledgements
This work is funded by the Gordon and Betty Moore Foundation through Grant GBMF3269.
This work is the result of a collaboration between University of California, Irvine (Yang Chen and Jim Randerson), NASA Goddard Space Flight Center (Doug Morton and James Collatz), Columbia Univeristy (Ruth DeFries and Miriam Marlier), University of Maryland (Louis Giglio), and Duke University (Prasad Kasibhatla).
NASA provided the satellite observations of fires and NOAA provided the sea surface temperature time series used in our analysis. The interactive figures and maps were generated using Google's Chart API , Maps API, and Fusion table API .
Disclaimer
The model predictions contained on this website are highly experimental. They cannot be used to predict the occurrence of individual fires. Use of this information for planning purposes should also draw upon other independent and reliable climate information sources. The Regents of The University of California will not be liable for any consequences that may occur if you rely on this information.
Contact: Yang.Chen@uci; Updated in April 2012