| [home] [Publications] [CP-El Nino] [New CGCM] [ENSO] [Monsoon] [Indian Dipole] [PDO] [TIW] [Tropics-Extratropics] [Cloud] [Jetstream] [Regional] [Gap Wind] |
OVERVIEW
Upper-ocean heat budget analyses are performed to suggest that the generation of the CP El Nino is related to the trade winds forcing associated with the variation of northern subtropical high. Wind-induced surface heat flux and meridional and vertical advections dominate the onset of the CP El Nino, which spread SST anomalies from the northeastern subtropical to the central equatorial Pacific. Local air-sea interactions at the equator further intensify the SST anomalies to become CP El Nino events. The variation of the subtropical high is shown to be linked to interannual Asian-Australian monsoon variations. Biennial (~2.5 years) timescales are found to appear in CP El Nino, subtropical high, and monsoon variations.
Experiments are conducted with the NCAR CCSM3, in which the model produces biennial El Nino closer to the central Pacific, to further examine the connection between CP El Nino and the Indian Ocean and monsoons. It is found that the biennial model El Nino is significantly reduced in a CCSM3 experiment where the Indian Ocean coupling is turned off. It is noticed that the decoupling also weakens the biennial variability in the simulated Australian and Indian monsoons. This modeling result further suggests a close link between the CP El Nino and the tropical biennial variability.
Monthly CP Index and EP Index (following Kao and Yu (2009; JCLI) and Yu and Kim (2010; GRL)
The following monthly EP and CP indices are calculated using this regression-EOF method (Kao and Yu 2009; Yu and Kim 2010) from ERSST data set (Smith and Reynolds, 2003): (01/1948-01/2021 is used for the calculation of the SST climatology and the detrending)
"CONSENSUS CP & EP EL NINO EVENTS" from Yu et al. (2012; GRL)
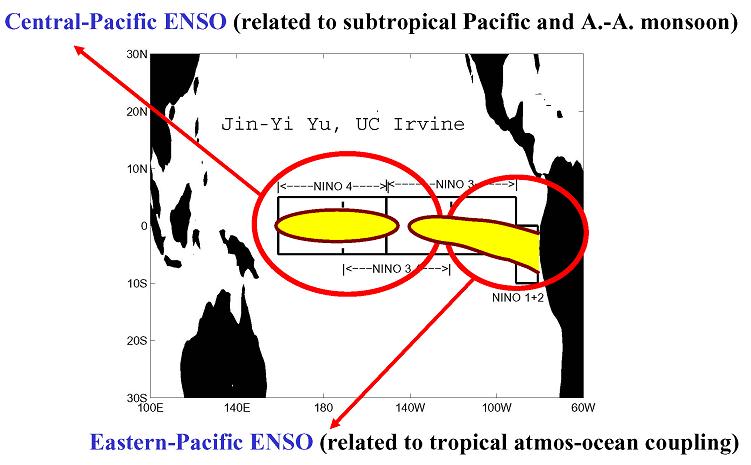
We were among the first to suggest that there are two different types of El Nino and the first to introduce the terms, Central-Pacific (CP) El Nino and Eastern-Pacific (EP) El Nino (Yu and Kao 2007; Kao and Yu 2009), for these two types of El Nino. The EP El Nino is the conventional type of El Nino that has its SST anomaly center located near the South America Coast and has its generation mechanism tied to thermocline variations. The CP El Nino has its SST anomaly center located close to the date line and its generation mechanism may be influenced more by atmospheric forcing than by basin-wide thermocline variations. The evolution and telelconnection of the CP El Nino are contrasted with those of the EP El Nino.
A regression-EOF analysis (Kao and Yu 2009; Yu and Kim 2010) is used to identify the strengths of the CP and EP types of ENSO in the SST data. With this method, the SST anomalies regressed with the Nino1+2 SST index are removed from the total SST anomalies before an EOF analysis was applied to obtain the spatial pattern of the CP ENSO. Here the regression with the Nino1+2 index (0-10S; 80W-90W) is considered as an estimate of the influence of the EP ENSO, which should be removed to better reveal the SST anomalies associated with the CP ENSO. Similarly, we subtracted the SST anomalies regressed with the Nino4 index (i.e., representing the influence of the CP ENSO) from the total SST anomalies before the EOF analysis was applied to identify the leading structure of the EP ENSO.
Monthly CP Index (January 1870 - February 2024)
Updated on 2/2024
Monthly EP Index (January 1870 - February 2024)
Updated on 2/2024
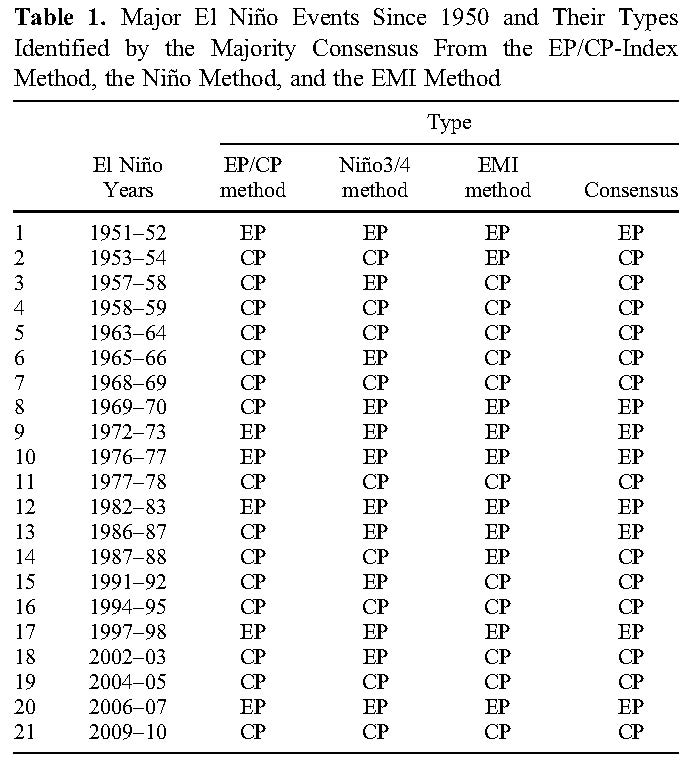
In Yu et al. (2012), we produced a table that identified the type of
the major El Nino events that occurred during 1950-2010. Here, the El
Nino events were selected based on NOAA.s criterion that the Ocean Nino
Index (ONI) be greater than or equal to 0.5C for a period of at least
five consecutive and overlapping three-month seasons. A total of 21
events are identified based on the ONI index and are listed in Table
1. We then determined the type of these 21 El Nino events based on the
consensus of three identification methods, which include the
EP/CP-index method of Kao and Yu [2009], the Nino method of Yeh et
al. [2009], and the El Nino Modoki index (EMI) method of Ashok et
al. [2007].
A Summary of My Work on Central-Pacific El Nino: Dynamics, Impacts, and Simulations
(1) Yu and
Kao (2007; JGR):
In this paper, we began to suggest that there are two different types of ENSO: one is the central-Pacific (CP) type, and the other is the eastern-Pacific (EP) type.
(2) Kao
and Yu (2009; JCLI):
We gave a full description of the surface and subsurface structures, temporal evolution, and global teleconnection of the two types of ENSO, and concluded that they have different generation mechanisms. We argued that the CP ENSO is produced by atmospheric forcing but not the thermocline variation that produces the conventional EP ENSO.
(3) Sun
and Yu (2009, JCLI):
We showed that the existence of the two types of ENSO enables the ENSO to modify the mean state of the tropical Pacific and in return the changed mean state affects the ENSO intensity. As a result of this ENSO-Pacific mean state interaction mechanism, the ENSO intensity moves back and forth between strong and weak regimes, giving rise to a 10-15year cycle. We argued that this decadal cycle is the reason why super El Nino events occurred in 1972, 1982, and 1997 (approximately every 10-15 years).
(4) Yu
et al. (2009; JCLI):
We argued that Asian-Australian monsoon is one source of the atmospheric forcing to excite the CP ENSO. To prove this hypothesis and to explain how it happens, we conducted numerical experiments with NCAR Community Climate system Model 3 (CCSM3) to show that the model CP ENSO can be reduced by 75% if the monsoon forcing is removed.
(5) Yu et
al. (2010a; JCLI):
We showed that the CP ENSO results from the interaction between the tropical Pacific Ocean and the Hadley circulation, while the conventional EP ENSO results from the interaction with the Walker circulation. Via the interaction with the Hadley circulation, extratropical sea level pressure (SLP) variations serve as another source of forcing (in addition to the monsoons) to excite the CP ENSO. We showed the CP ENSO onsets after the extratropical SLP variations spread equatorward, after which,
local ocean advection processes continue to intensify the CP ENSO anomalies. This series of development is different from the development of the conventional EP ENSO, which relies on basin-wide ocean interaction with the Walker circulation.
(6) Yu
and Kim (2011; JCLI):
The extratropical SLP variations that drive the CP ENSO are shown in this study to be associated with an
atmospheric phenomenon called North Pacific Oscillation (NPO), which is characterized by out-of-phase SLP variations between subtropics and higher latitudes. We also argued that the NPO can be forced by the EP ENSO. As a result, EP ENSO and CP ENSO can occur in sequences with the help of the extratropical atmosphere. Our theory explains why strong El Nino events that usually occur in the eastern Pacific tend to be followed by strong La Nina events in the central Pacific.
(7) Yu
and Kim (2010b; GRL):
We identified in this study 12 CP El Nino events since 1960 and examined their evolution. We found the CP ENSO can decay in three different ways: abrupt termination, prolonged (or slow) termination, and symmetric (with respect to the growth) termination. The key feature to determining the selection of the decay pattern was found to be the mean thermocline depth along the equatorial Pacific. If we know the thermocline depth, we may predict whether a CP El Nino event is going to get terminated abruptly,
slowly, or normally. This study was the first prediction study of the CP ENSO and was selected for GRL Editors Highlight.
(8) Yu
and Kim (2010c; GRL):
Since there are only a few CP ENSO events available in the observations, we need to analyze extended CGCM simulations to better understand the CP ENSO. In this study, we analyzed IPCC AR4/CMIP3 model simulations to determine how many of these models can realistically capture both the EP and CP ENSOs. We concluded that six AR4 models can capture both types of ENSO with realistic intensities. Our analysis also showed that new information on ENSO dynamics and model performance can be revealed if we separate model ENSOs into these two types. This paper is the first CMIP3 model intercomparison study for the CP/EP ENSO.
(9) Yu et
al. (2011; TAC):
In this study, we developed subsurface ocean index to better identify and separate EP and CP ENSOs. We used these indices to determine which ENSO event is EP or CP type. The transitions between EP and CP ENSOs were also examined.
(10) Yu
and Kim (2011, JCLI):
We usedCMIP3 model simulations to support our hypothesis that decadal ENSO modulations can be
produced from an ENSO-mean state interaction mechanism (proposed by Sun and Yu 2009).
(11) Kim et
al. (2012, MWR):
We analyzed NCEP's CFS coupled model and concluded the model can simulate the both types of ENSO, but the simulated CP ENSO tends to be too weak due to undersimulated influences of the North Pacific Oscillation (NPO) on the central equatorial Pacific. The NPO influences in the model fail to penetrate
deep into the tropics and tend to persist less. The underestimation of California stratus in the model is suggested to be a cause of these model deficiencies.
(12) Kim
and Yu (2012; GRL):
We evaluated the intensity of the CP and EP types of ENSO simulated in the pre-industrial, historical, and the Representative Concentration Pathways (RCP) 4.5 experiments of the CMIP5 models. Compared to the CMIP3 models, the pre-industrial simulations of the CMIP5 models are found to (1) better simulate the observed spatial patterns of the two types of ENSO and (2) have a significantly smaller inter-model diversity in ENSO intensities. Ensemble means of the CMIP5 models indicate that the
intensity of the CP ENSO increases steadily from the pre-industrial to the historical and the RCP4.5 simulations, but the intensity of the EP ENSO increases from the pre-industrial to the historical simulations and then decreases in the RCP4.5 projections. The CP-to-EP ENSO intensity ratio, as a result, is almost the same in the pre-industrial and historical simulations but increases in the RCP4.5 simulation.
(13) Yu
et al. (2012, GRL):
We performed statistical analyses, numerical model experiments, and case studies to show that the impact on US winter temperatures is different for the different types of El Nino. While the conventional Eastern-Pacific El Nino affects winter temperatures primarily over the Great Lakes, Northeast, and Southwest US, the largest impact from Central-Pacific El Nino is on temperatures in the northwestern and southeastern US. The recent shift to a greater frequency of occurrence of the Central- Pacific type has made the Northwest and Southeast regions of the US most influenced by El Nino. It is shown that the different impacts result from differing wave train responses in the atmosphere to the sea surface temperature anomalies associated with the two types of El Nino.
(14) Yu et
al. (2012b; ERL):
We examined a reanalysis dataset covering the period 1979-2009 to show that the sea surface temperature (SST) variability in the tropical central Pacific is more closely related to the SST variability in the tropical eastern Pacific before 1990 but more closely related to sea level pressure (SLP) variations associated with the North Pacific Oscillation (NPO) after 1990. Only during the period after 1990 can the NPO excite large SST variability in the tropical central Pacific. Related to this change, El Nino Southern
Oscillation (ENSO) SST anomalies tend to spread from the eastern to central tropical Pacific before 1990 in a pattern resembling that associated with the Eastern Pacific (EP) type of ENSO, but are more closely connected to SST variability in the subtropical north Pacific after 1990 with a pattern resembling that of the Central Pacific (CP) type of ENSO. This study concludes that the increased influence of the
NPO on the tropical Pacific is a likely reason for the increasing occurrence of the CP type of ENSO since 1990. An analysis of the mean atmospheric circulation during these two periods suggests that the
increased NPO influence is associated with a strengthening Hadley circulation after 1990.
(15) Yu and Zou (2013; ERL):
In this study, we use statistical analyses, numerical model
experiments and case studies to show that the Central-Pacific El Ni.no enhances the drying
effect, but weakens the wetting effect, typically produced by traditional Eastern-Pacific El
Ni.no events on the US winter precipitation. As a result, the emerging Central-Pacific El Ni.no
produces an overall drying effect on the US winter, particularly over the Ohio.Mississippi
Valley, Pacific Northwest and Southeast. The enhanced drying effect is related to a more
southward displacement of tropospheric jet streams that control the movements of winter
storms. The results of this study imply that the emergence of the Central-Pacific El Ni.no in
recent decades may be one factor contributing to the recent prevalence of extended droughts in
the US.
(16) Yu and Kim (2013; International Journal of Climatology): This study develops a pattern correlation method to determine the type of major El Nino events since 1870 .
from a reconstructed sea surface temperature dataset. Different from other identification methods, this method allows an
El Nino event to be of the Central-Pacific (CP) type, the Eastern-Pacific (EP) type, or the Mixed type (i.e. the both types coexist). Table 1 provides information on El Nino type for events that have occurred during the period of 1870-2010 asbased on four identification methods.
[home]
[Publications]
[CP-ENSO]
[New CGCM]
[ENSO]
[Monsoon]
[Indian Dipole]
[PDO]
[TIW]
[Tropics-Extratropics]
[Cloud]
[Jetstream]
[Regional]
[Gap Wind]