Group 1 - William Amos, Andrew Hnat, and Marcus Firstman
Spatial Feasibility of Renewable Energy in California (Video)
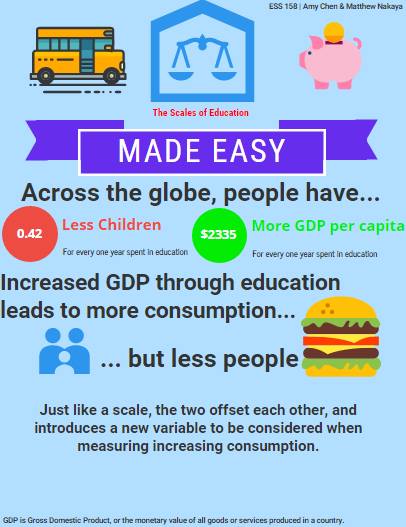
Group 2 - Amy Chen and Matt Nakaya
Education’s effect on GDP offset by change in population growth (Infographic)
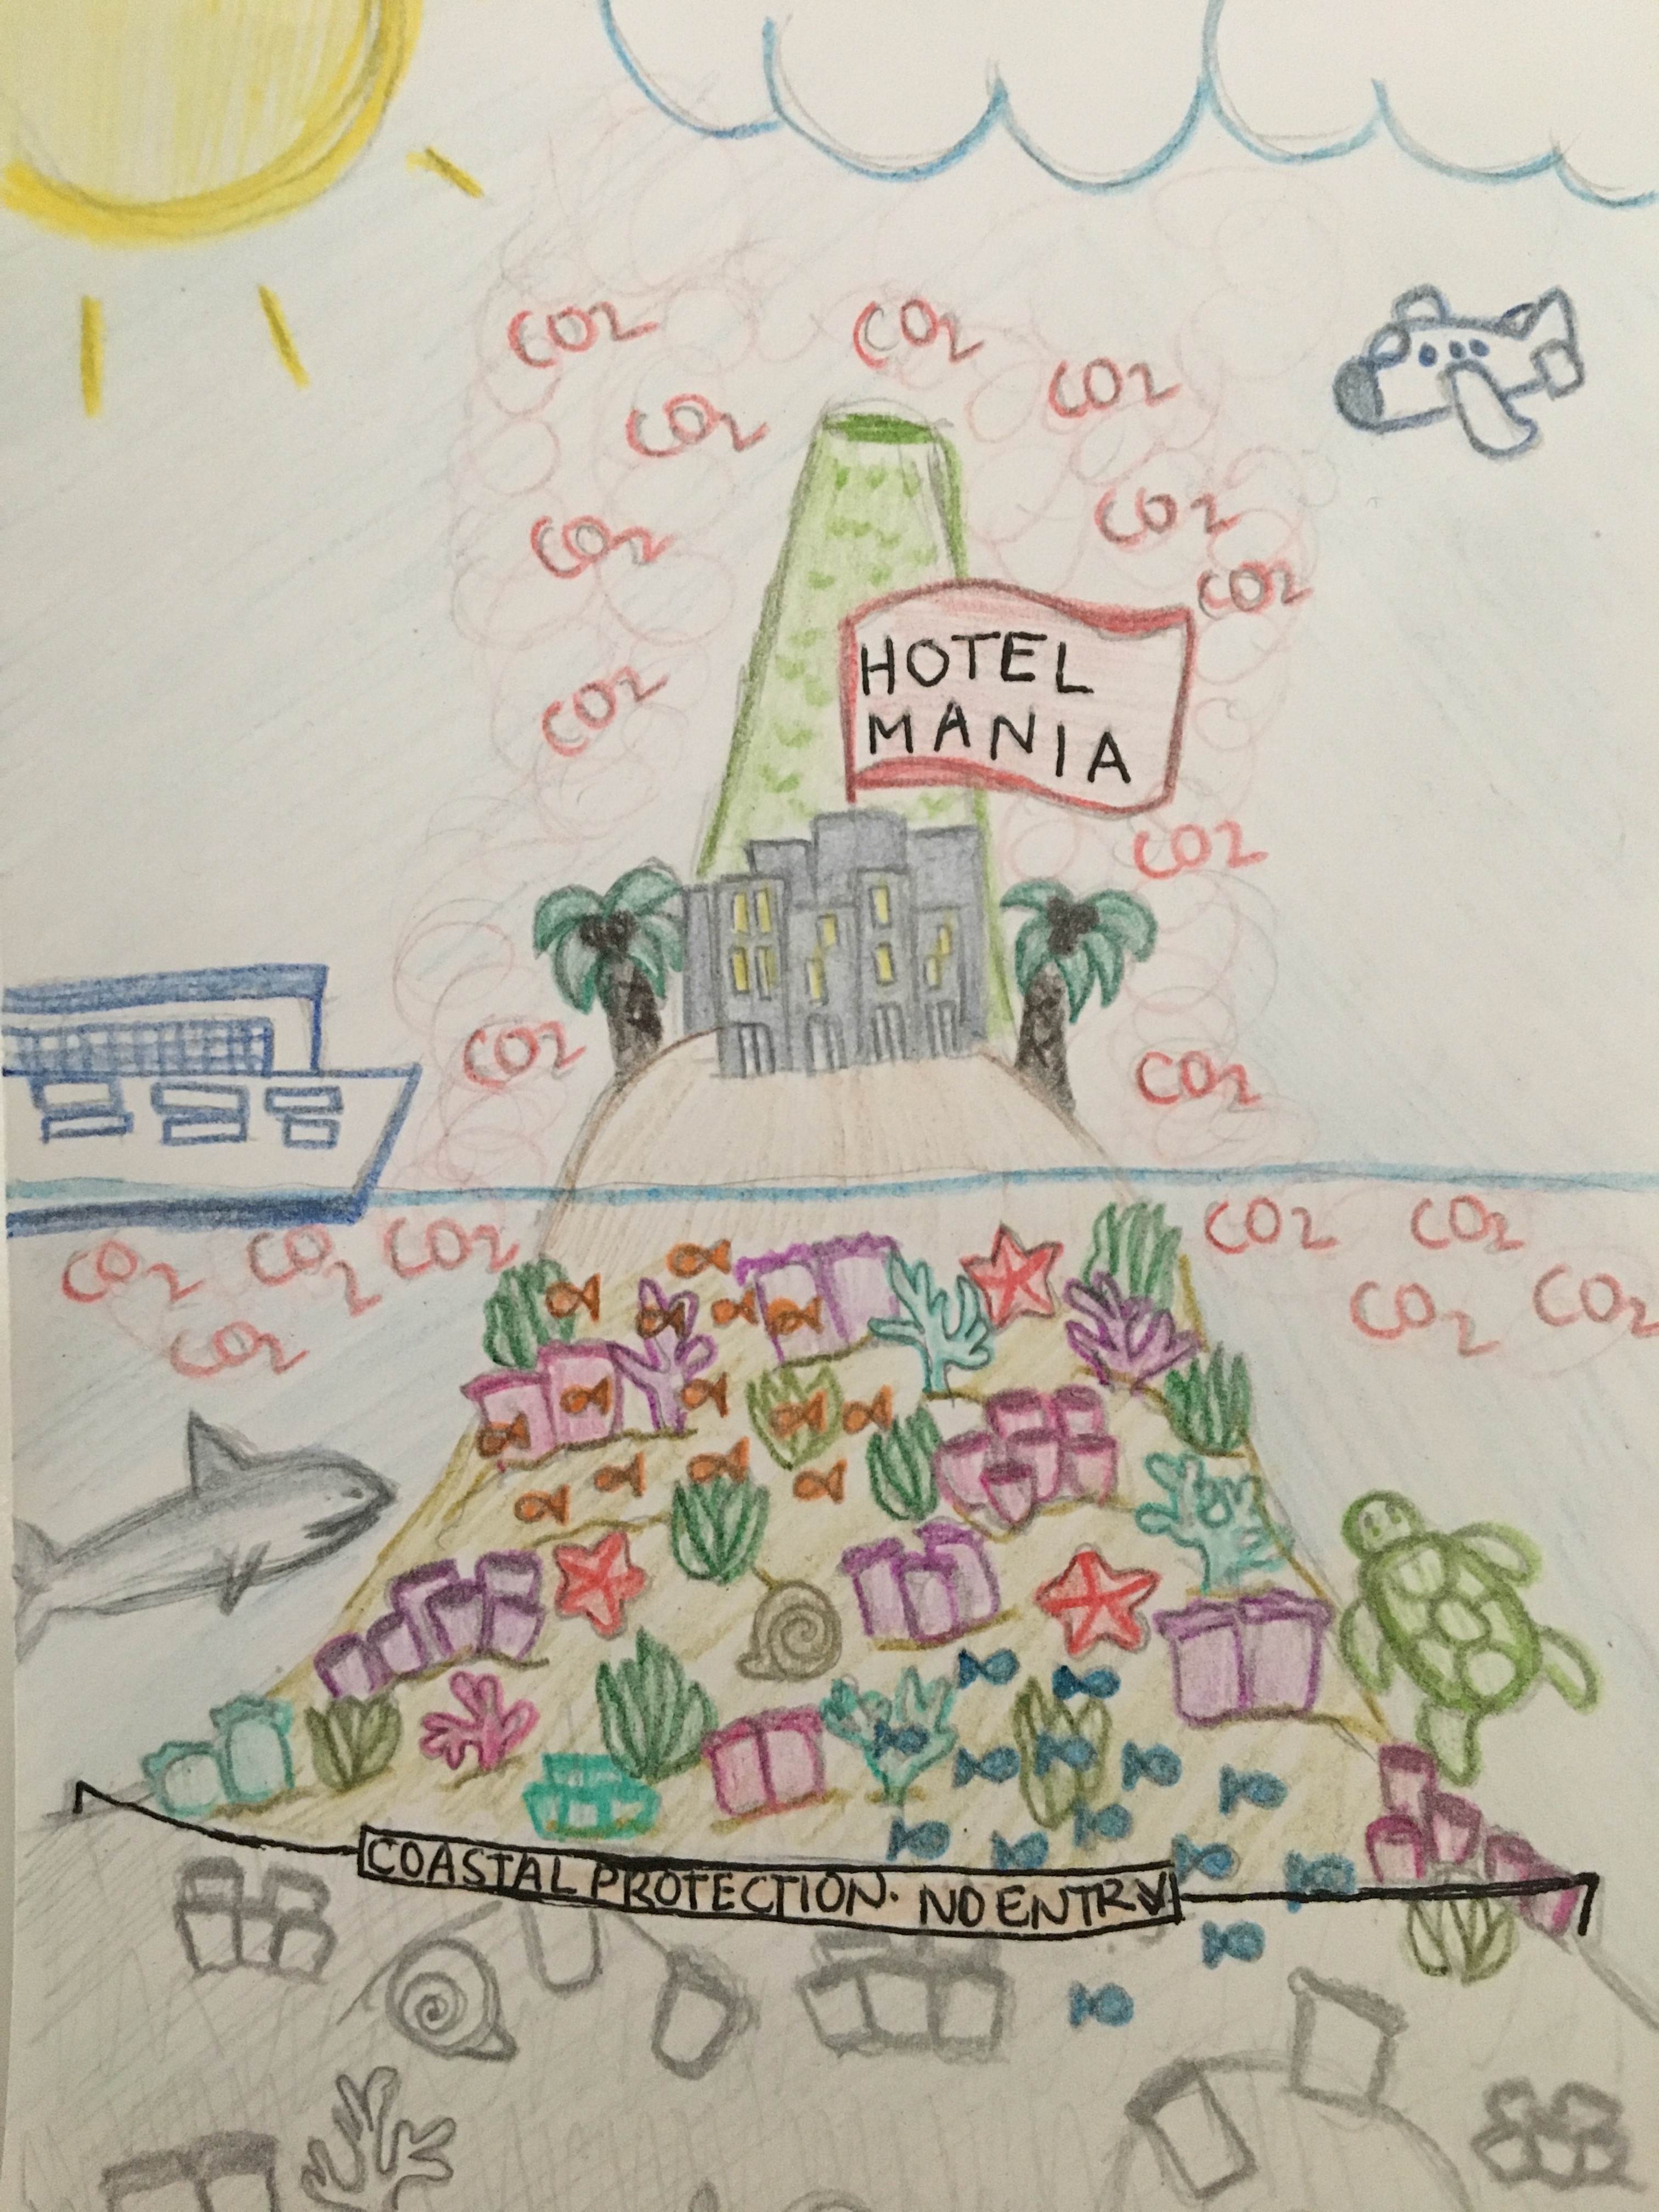
Group 3 - Maryam Faall and Tyanna Bui
Tourism and the Health of the Coral Reefs (Infographic)
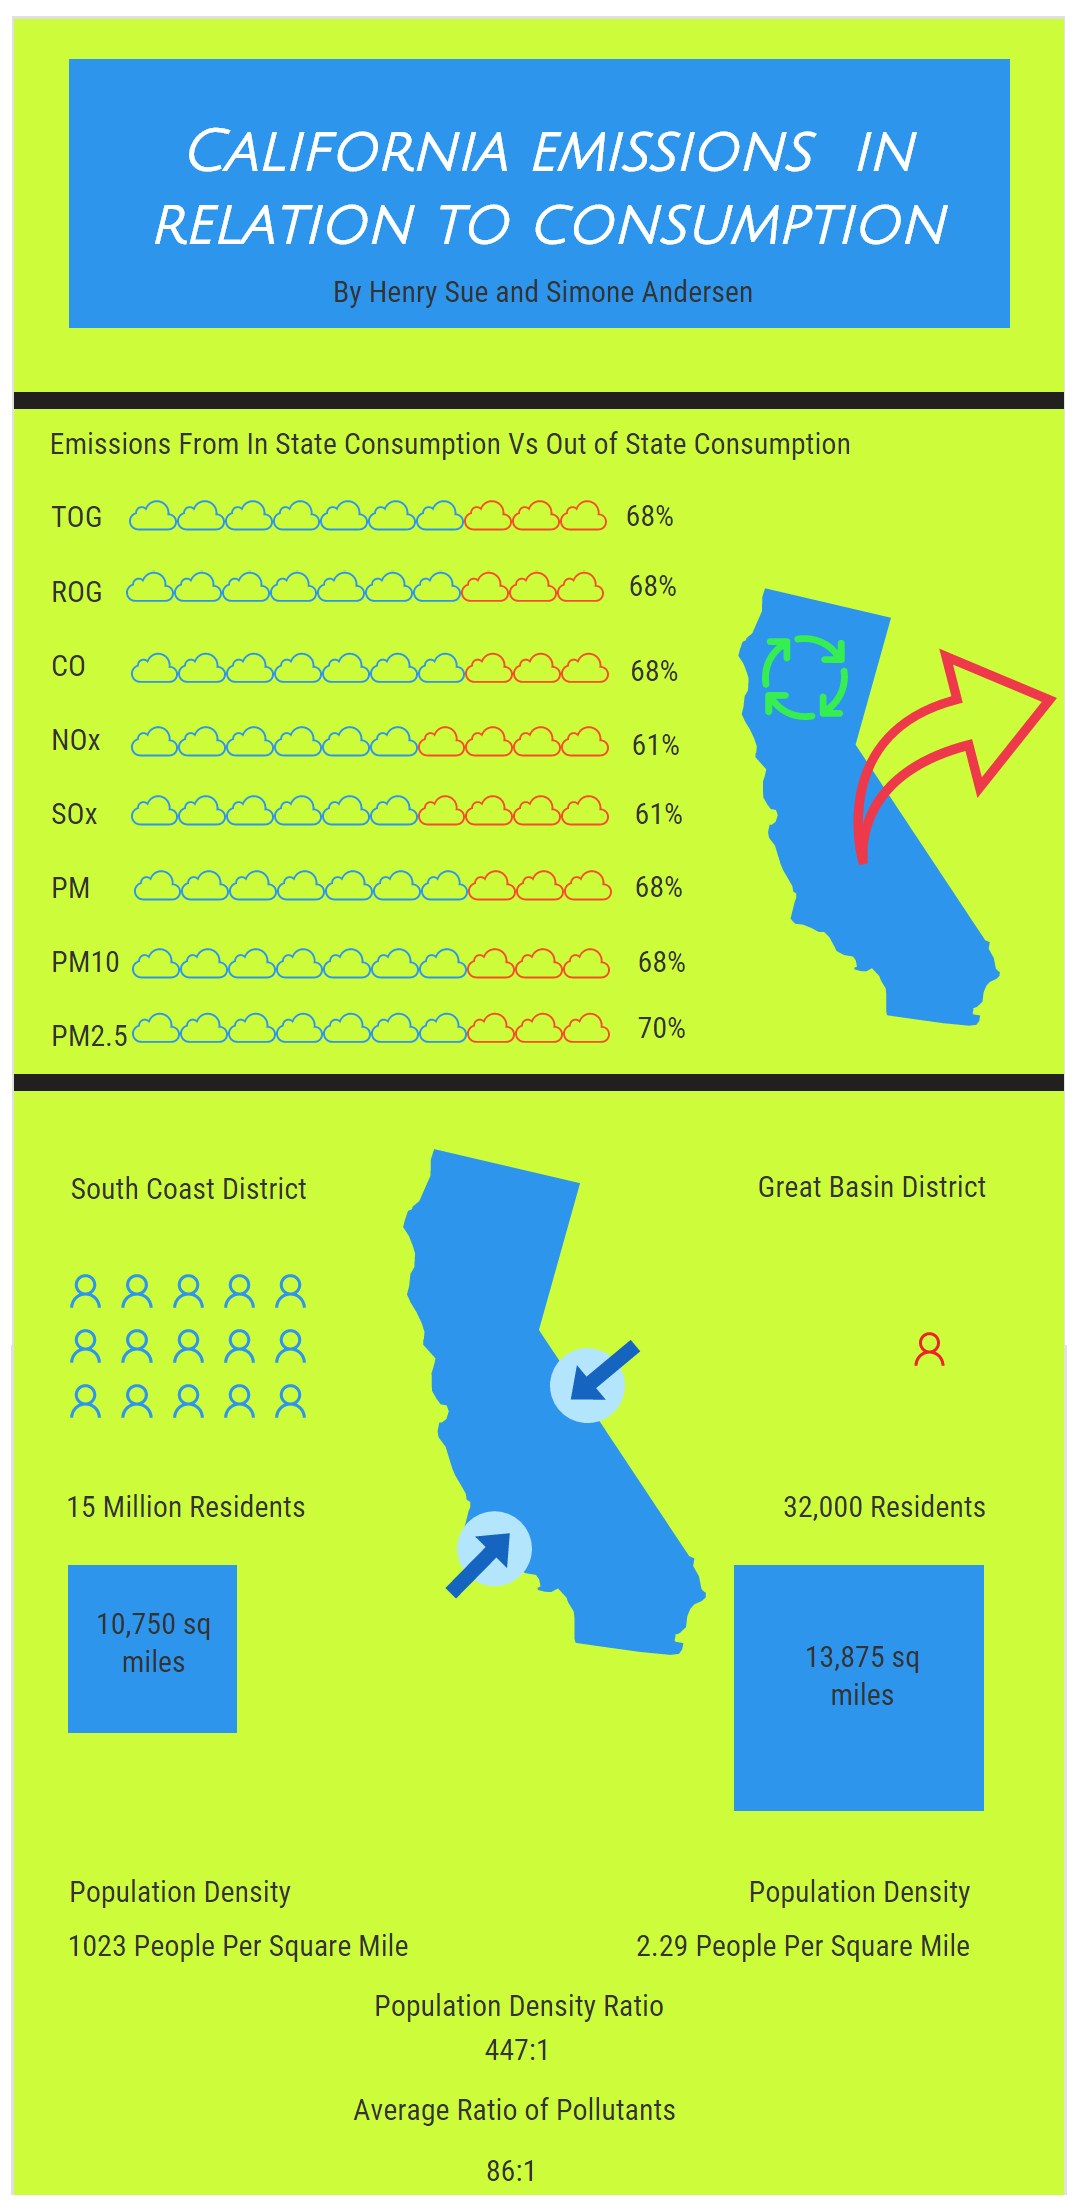
Group 4 - Simone Andersen and Henry Sue
Air pollution in California caused by consumption (Infographic)
Group 5 - Nicholas Paganini1, Rachel Pennington1, and Scott Cameron
Charting the Relationship between Land Use, Exports, and Income Inequality (Video animation)
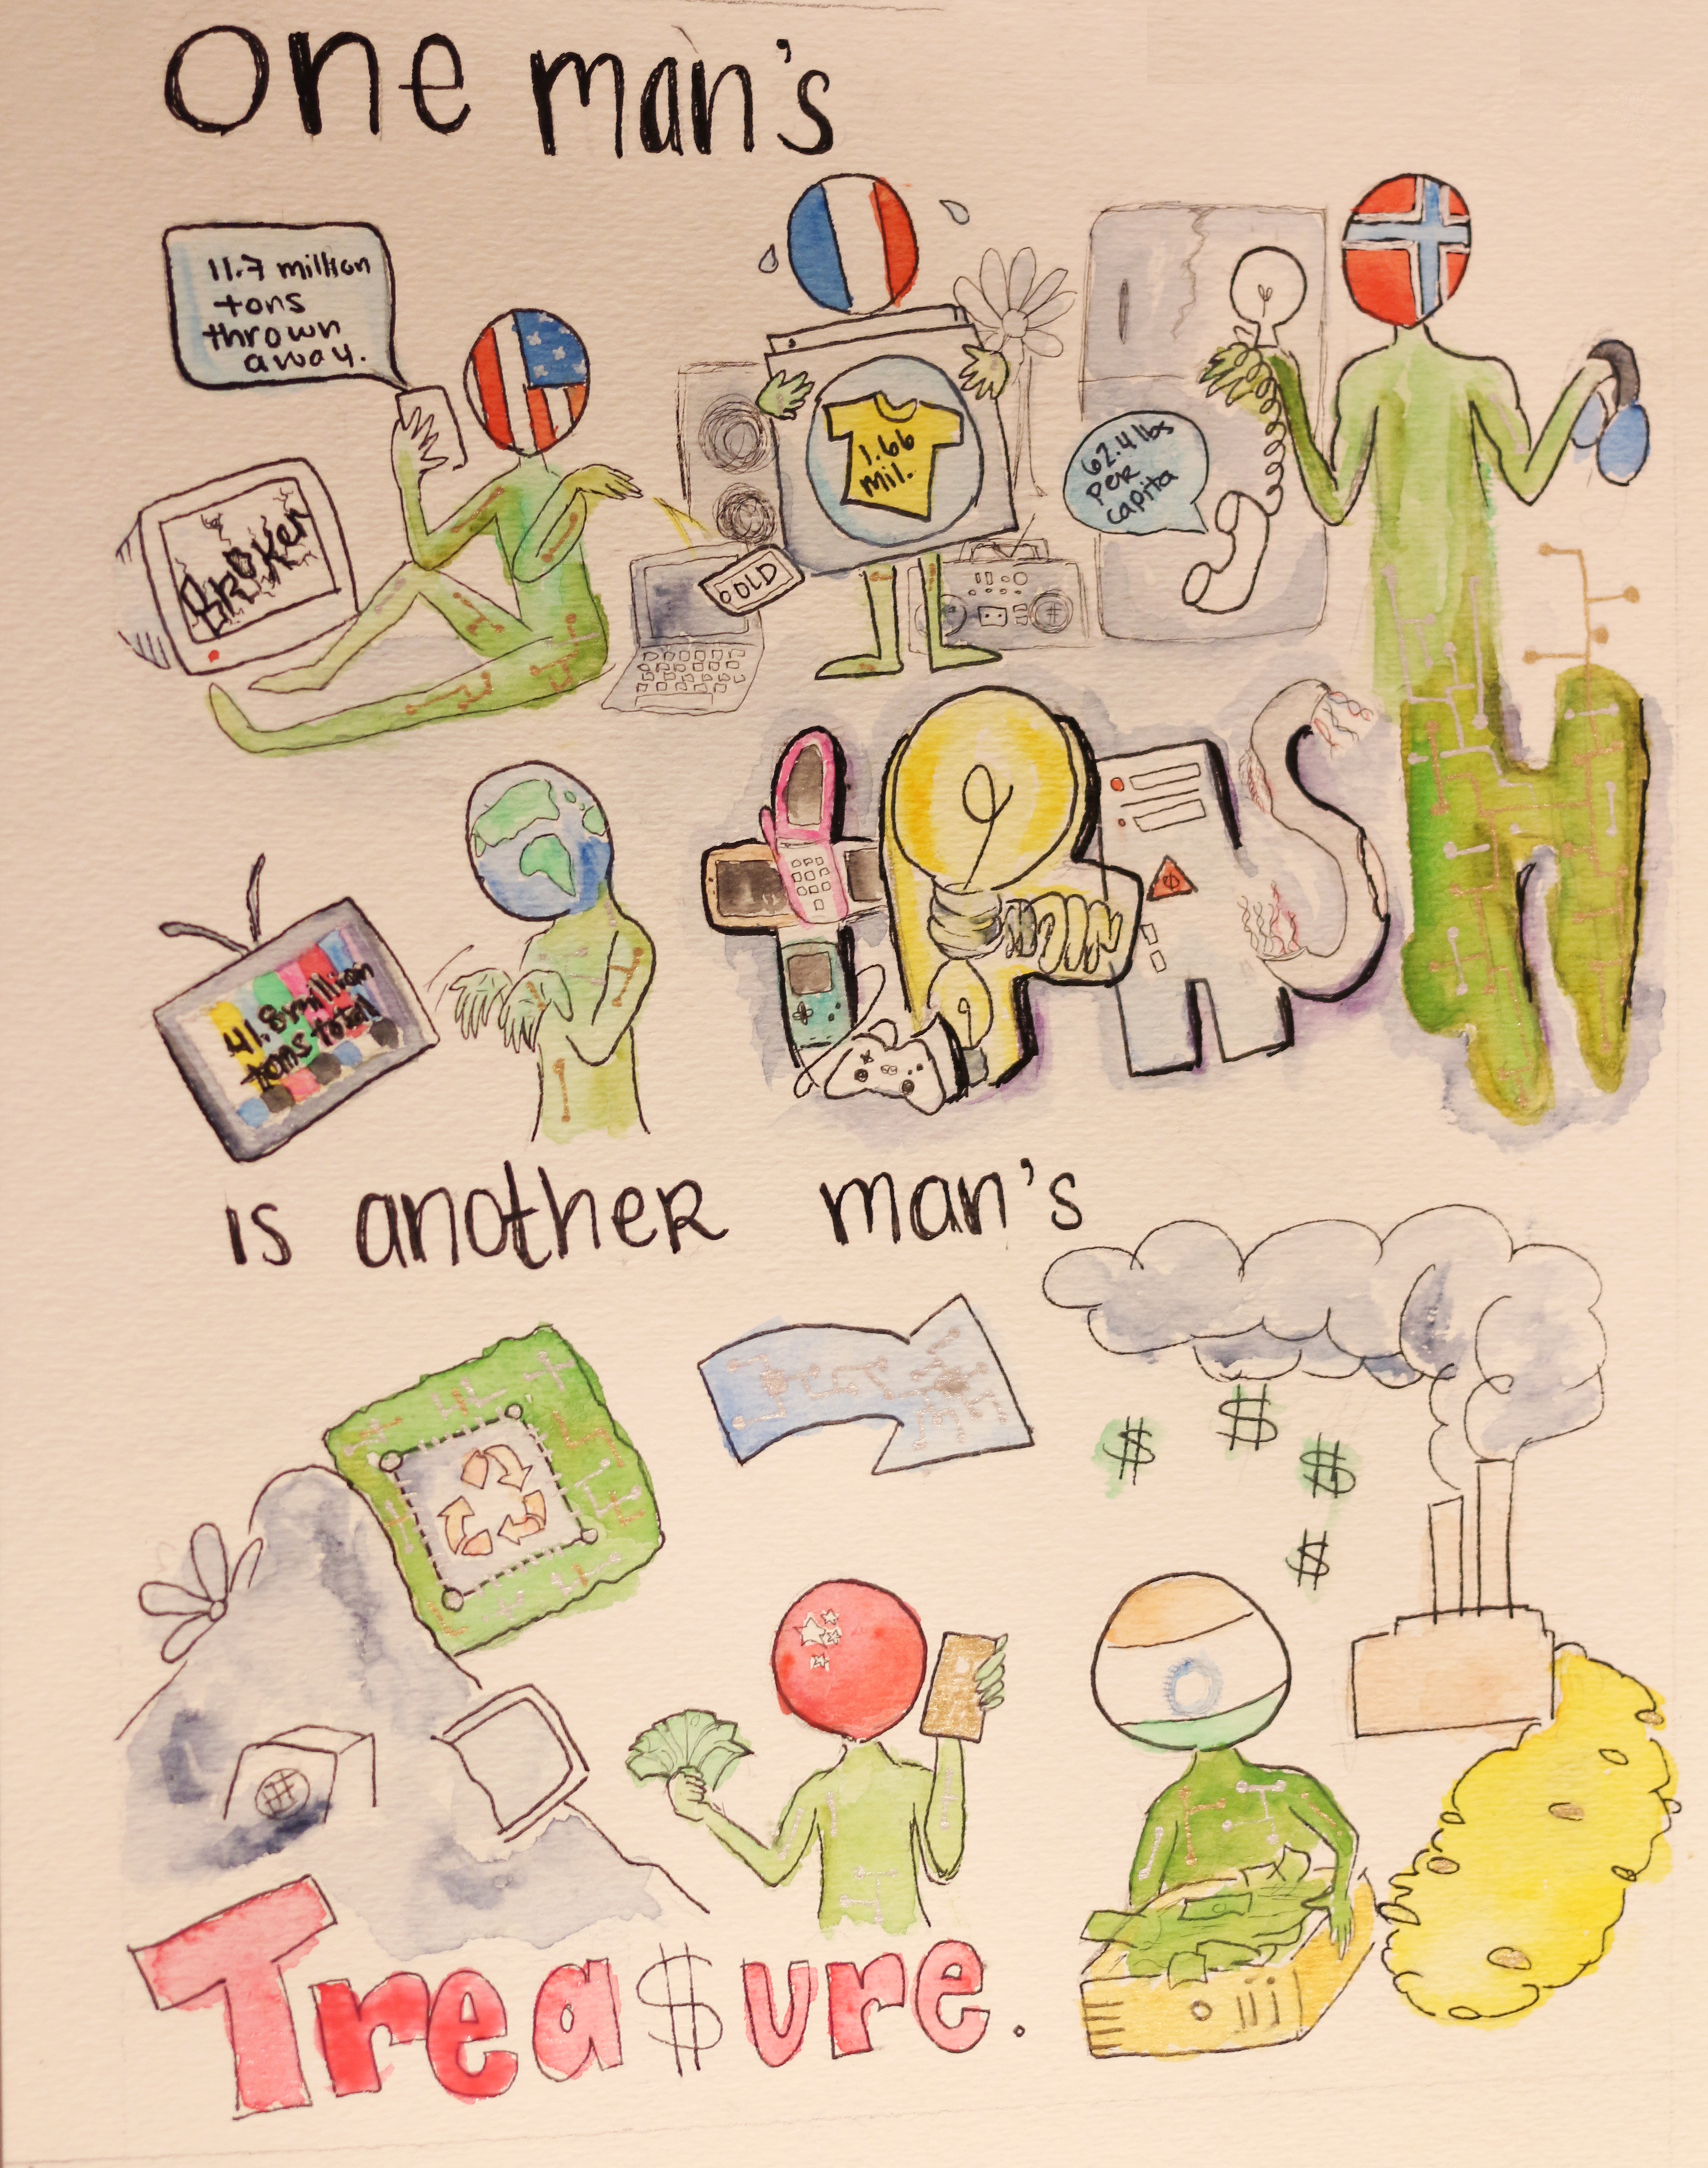
Group 6 - Tiffany Nguyen and Charles Ke
Electronic Waste and its Effect on GDP per Capita (Infographic and Video)
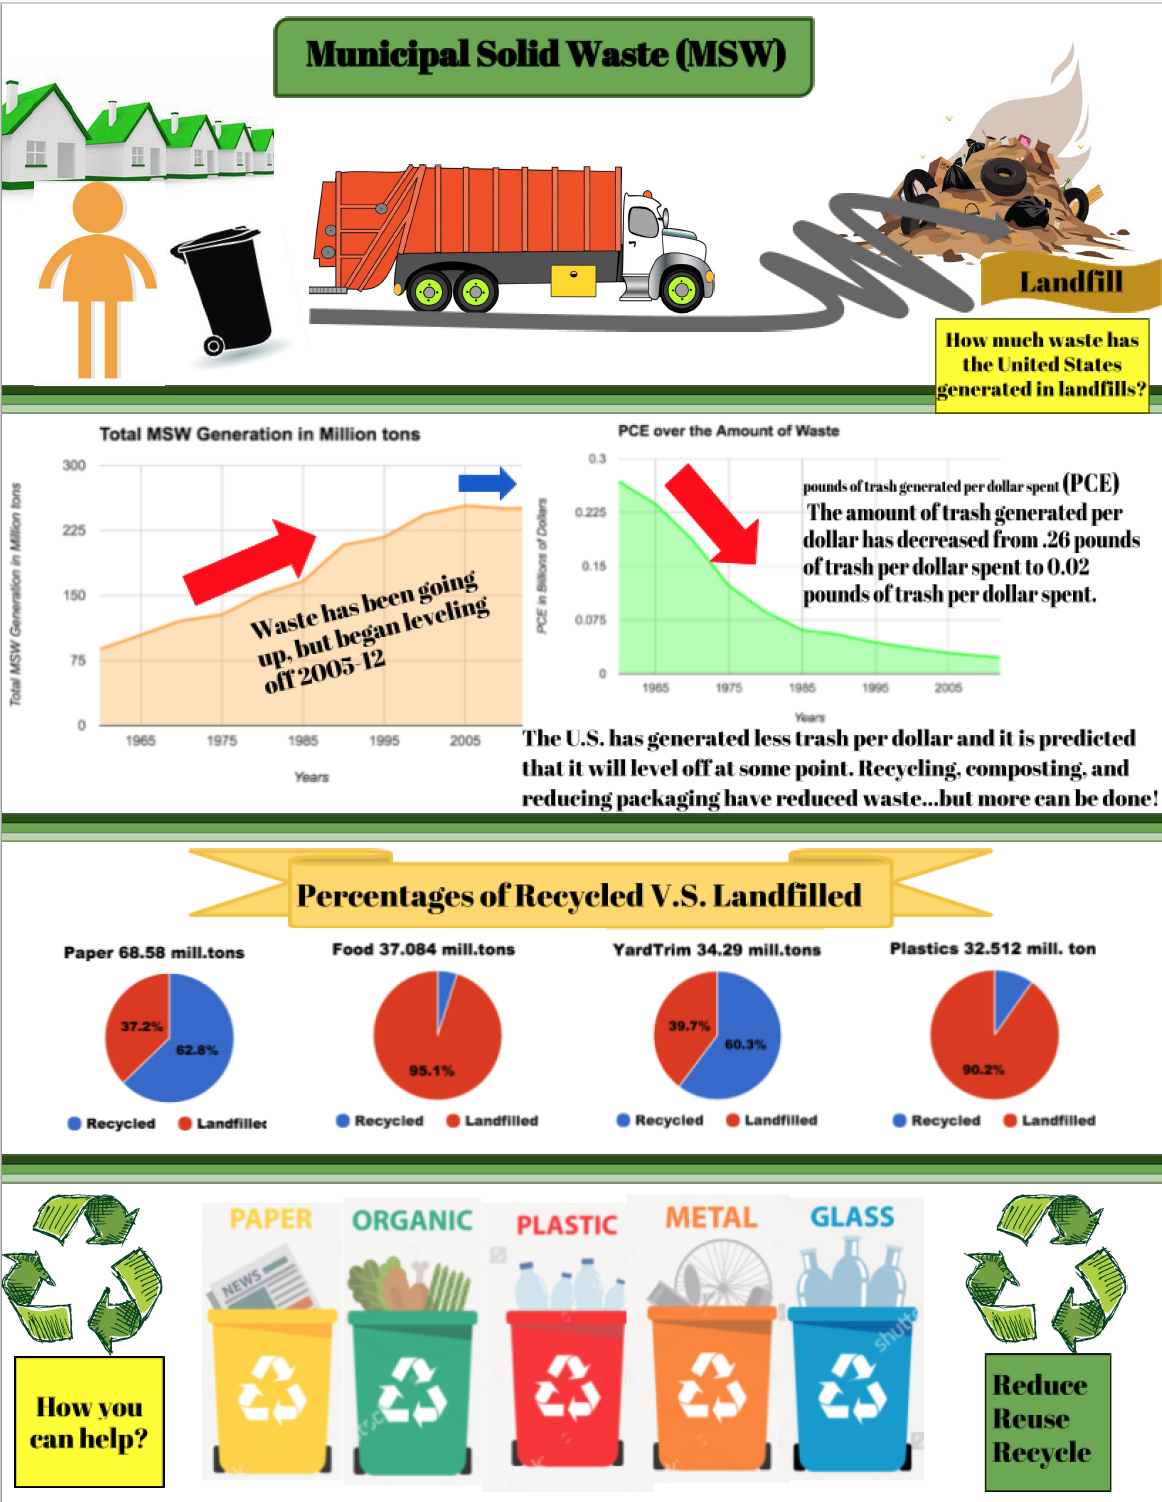
Group 7 - Elaine Lopez, Taylor Anderson and Mayra Rizo
United States Municipal Waste Management (MSW): What’s Really Going On? (Infographic)
Group 8 - Julia Badrya and Jade Barrilleaux
Quantifying the impacts of anthropogenic plastic debris on marine ecosystems (Video)
Group 9 - Cann Doan and Keren Ramirez
Environmental Education (Video)
Group 10 - Erin Chen, Isabel Rivera, and Isabel Mora
Food Waste: An economic approach to the demand and supply elasticity in the U.S (Animated video)
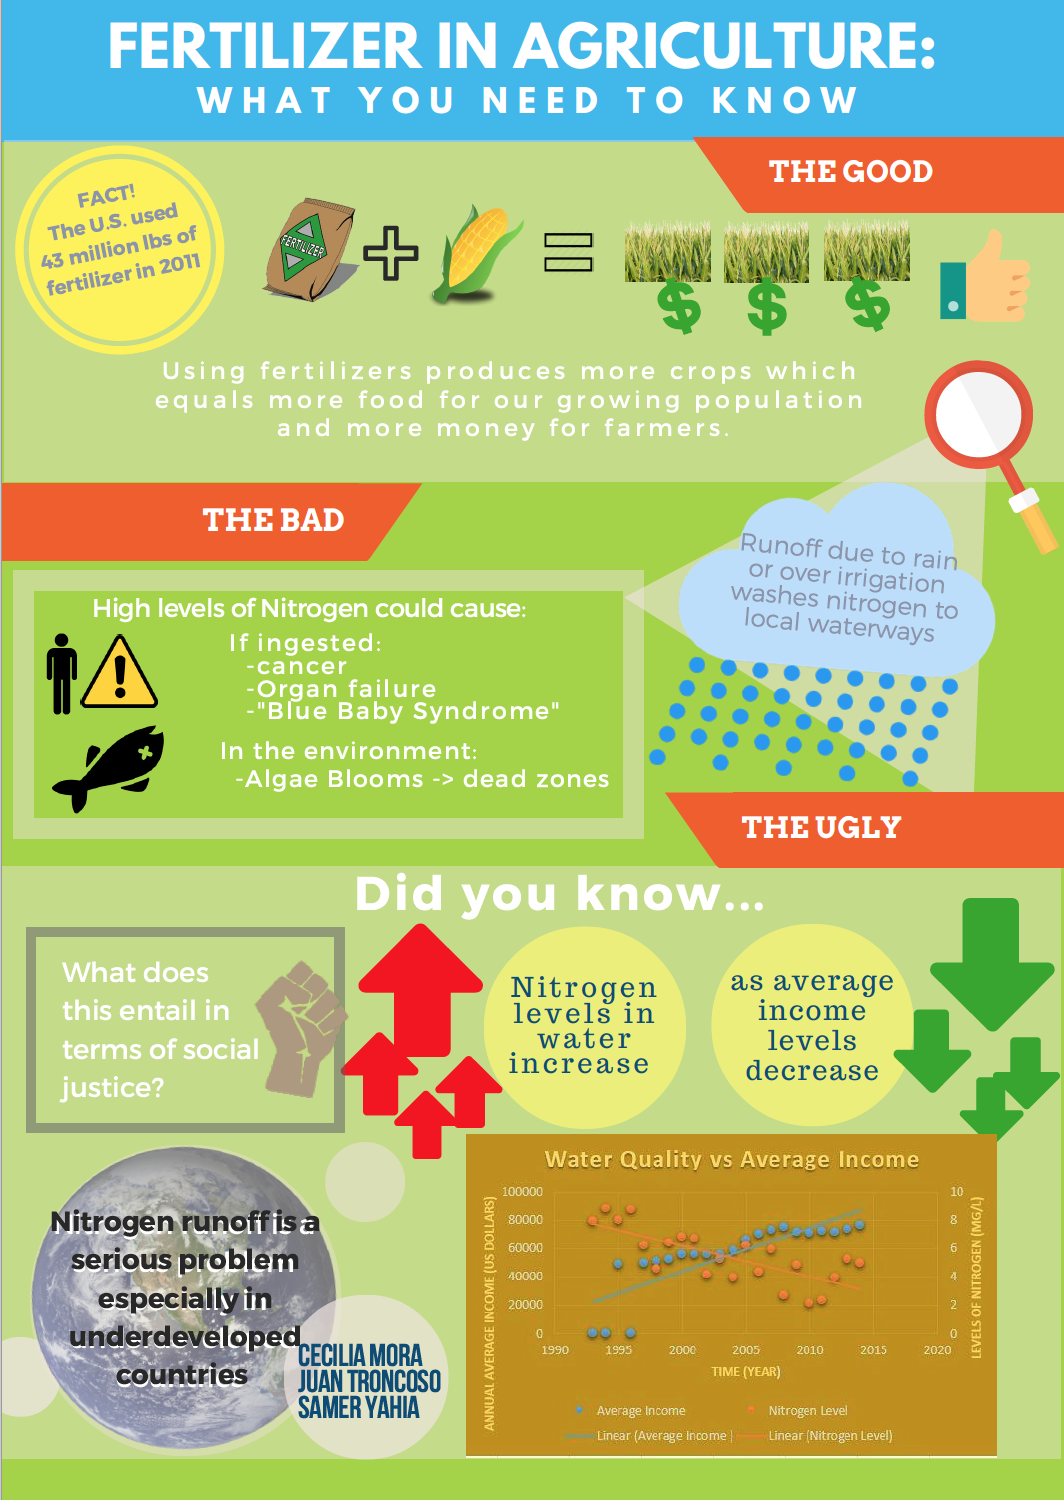
Group 11 - Juan Troncoso, Samer Yahia, and Cecilia Mora
Agriculture and Its effect on Nearby Water Sources and Its Relevance to Income Difference (Infographic)
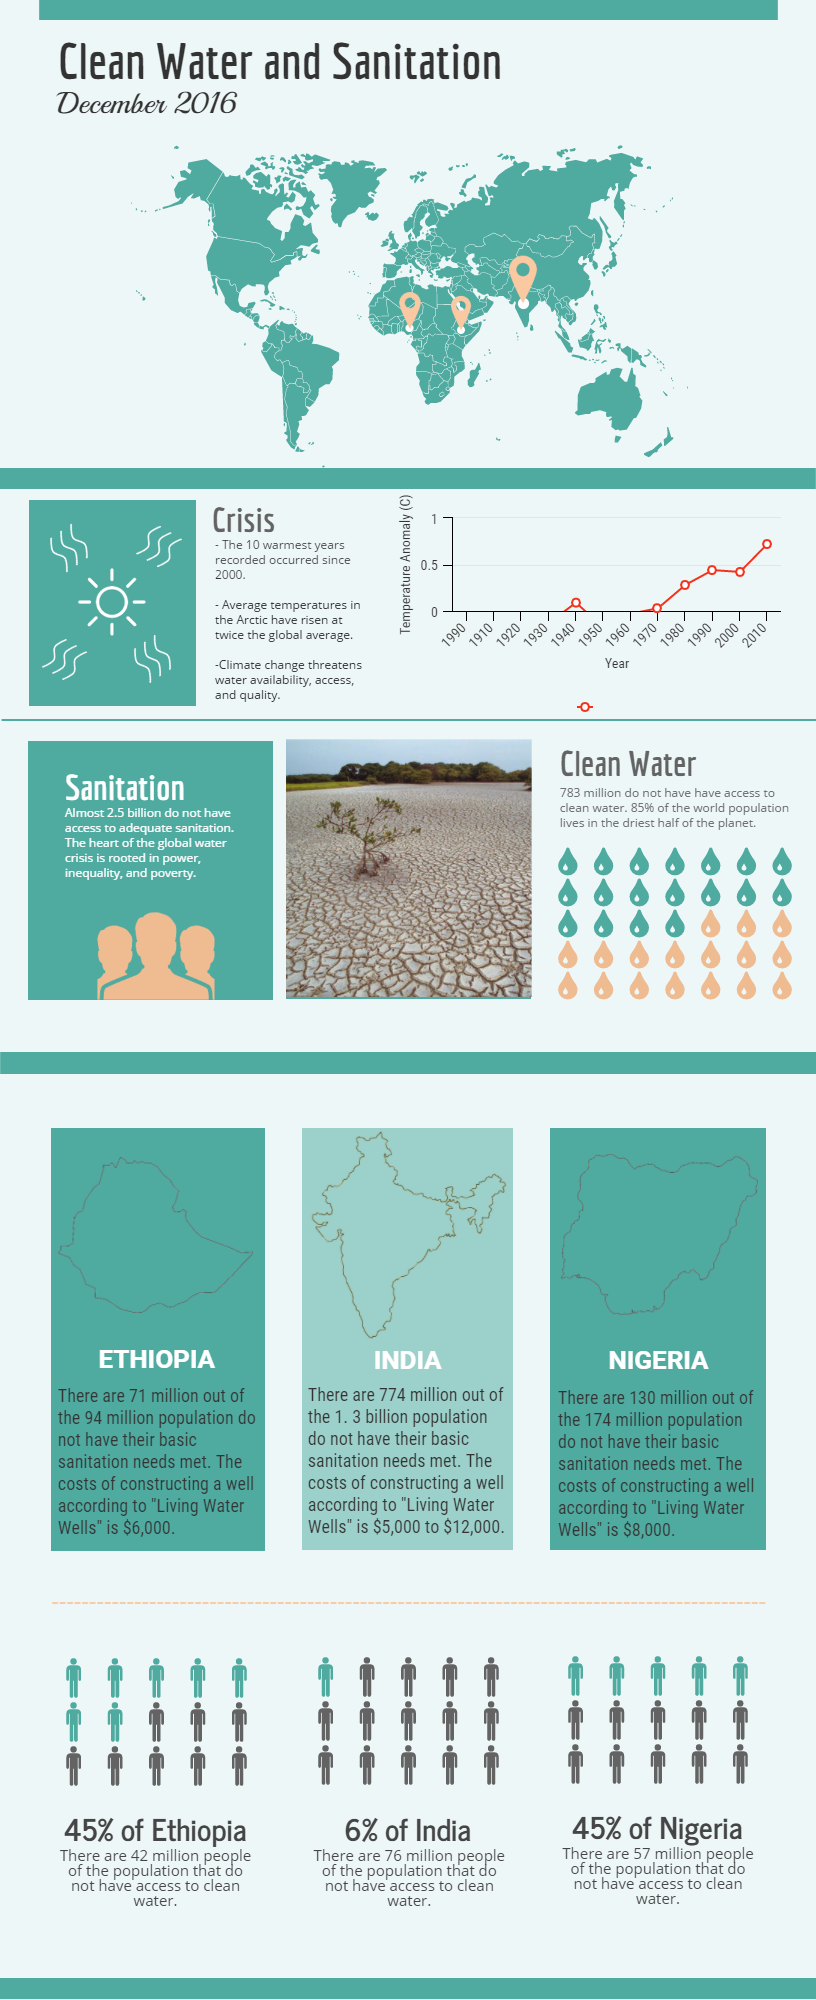
Group 12 - Ela Chavarria, Khrystal Alas, and Bryan Suarez
Costs and Investments of Water Access and Wastewater Treatment (Infographic)