


Overview of the 2020 fire season severity prediction
Fire season severity outlook
Sea surface temperatures (SSTs) in the tropical Pacific Ocean and North Atlantic Ocean during early 2020 were significantly higher than the mean values during the 2001-2015 period of satellite fire observations. By combining the SSTs in both oceans, we projected a high fire risk for Acre, El Beni, Mato Grosso, Pando, Para, Rondonia, and Santa Cruz, and an above-average risk for Amazonas, Maranhao, and Peru during the 2020 dry season.
This webpage presents a prediction of fire risk for the 2020 dry season in high biomass burning regions of South America. The following figure presents fire season severity indices (FSSI, ranging from 0-100) for 6 states in Brazil (Acre, Amazonas, Maranhão, Mato Grosso, Pará, and Rondônia), 3 departments in Bolivia (El Beni, Pando, and Santa Cruz), and one country (Peru) using sea surface temperature information through the end of May. Green indicates below average predictions of fire activity whereas orange and red indicate above average activity. A detailed description of the prediction method is given here.
Fire observations and predictions
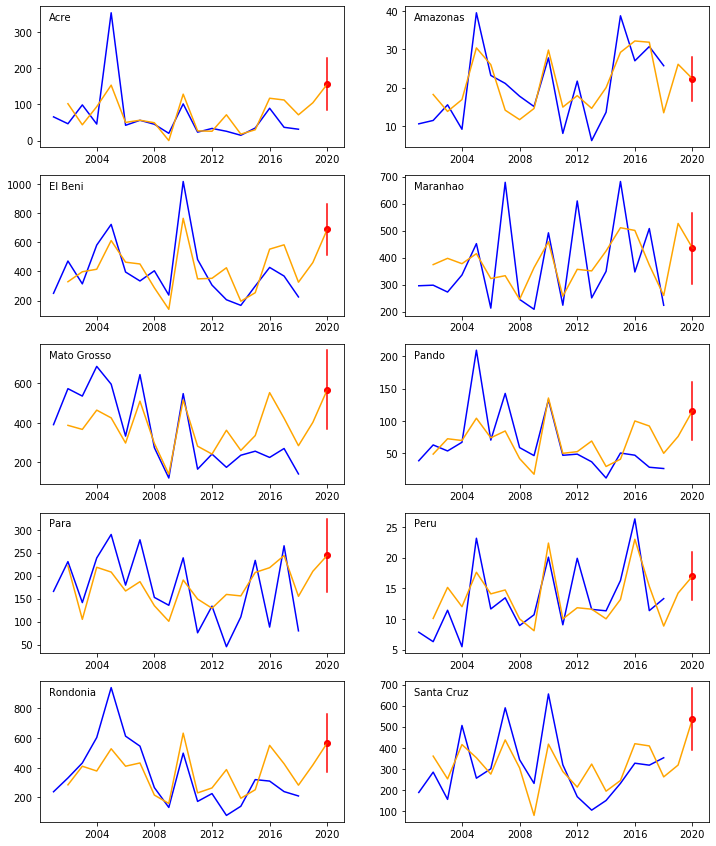
Fire Season Severity (FSS) predictions compared to observations
This figure compares the observed and modeled FSS in South America fire regions. The blue solid lines are observations for past years. The orange lines are FSS derived from the empirical model. Information on sea surface temperatures through March of 2020 were evaluated for these predictions.
Fire-climate conditions
Ocean climate indices
To predict FSS in South America, we used two climate indices that represent the sea surface temperature anomalies in Pacific and Atlantic: ONI (Ocean Niño Index) and AMO (Atlantic Multidecadel Oscillation index). The following figure shows time series of ONI and AMO since 2000.
Relationship between ocean climate indices and FSS
- Linear regression analyses show that the annual FSS is most strongly correlated with ONI and AMO between October (previous year) and April. Here we show the monthly ONI and AMO values during this period eath year. Colors from dark blue to dark red represent the order of lowest to highest fire years.
Method
The method of annual FSS prediction is based on Chen et al. (2011) with some modifications. We developed our empirical model of FSS using fire counts detected by MODIS onboard NASA's Terra satellite along with Oceanic Niño Index (ONI) and Atlantic Multidecadal Oscillation index (AMO) SST anomaly time series. Sea surface temperatures prior to the onset of the fire season have the strongest relationship with the number of satellite observed fires during the fire season in many areas of South America. The lead times enable us to make a prediction for the upcoming fire season.
Data
- Active fire counts
- ONI
- AMO
We used MODIS collection 5 global monthly fire location product (MCD14ML). We sampled the geographic coordinates of individual fire pixels (at a 1×1 km spatial resolution) that had a confidence level greater than 30%, and calculated the monthly FC within each 0.5° pixel after applying a cloud fraction correction. Persistent hot spots from MODIS observations and gas flare pixels in NOAA Global Gas Flare Estimates were excluded because the burning in these pixels is primarily associated with petroleum production rather than landscape fires. We then calculated the monthly FC for each region (6 states in Brazil (Acre, Amazonas, Maranhao, Mato Grosso, Para, Rondonia), 3 departments in Bolivia (El Beni, Pando, Santa Cruz), and one country (Peru)). The sum of FC during the fire season (defined as the 9-month period centered at the peak fire month) was recorded as the annual FSS for each region.
The Oceanic Niño Index (ONI) is a 3-month mean SST anomaly in the Niño 3.4 region (5°N-5°S, 120°-170°W) of the Pacific. We obtained the ONI time series from the NOAA National Weather Service Climate Prediction Center.
The Atlantic Multidecadal Oscillation index (AMO) represents a similar 3-month mean for the North Atlantic (0°-70°N). We obtained the AMO index time series from the NOAA Earth System Research Laboratory website.
Model
We defined our empirical predictive model as a linear combination of the two climate indices sampled during the months of maximum correlation:
FSSpredicted(x,t,τc)=a(x,τc)×ONI[t,m(x)-τONI(x,τc)]+b(x,τc)×AMO[t,m(x)-τAMO(x,τc)]+c(x,τc).
FSSpredicted is the predicted FSS in region x and year t. The parameter τc indicates the lead time (number of months before the peak fire month) when the prediction was made. a and b are spatial varying coefficients that represent the sensitivities of FSS in each region to ONI and AMO, individually, and c is a constant. ONI and AMO were sampled each year during months with lead times τONI and τAMO relative to the peak fire month ( m) in each region. Given a target τc, the optimal τONI and τAMO values were derived from a series of linear regressions using ONI and AMO values at different months (with a cutoff(minimum) lead time of τc).
Prediction
Based on the data (ONI and AMO) availability and the peak fire month, we derived the τc for each region. We then applied the predictive model with corresponding coefficients ( a, b, and c) and optimal lead times (τONI and τAMO) to derive the FSS in the target fire year. The range of the prediction was calculated using the 1-sigma uncertainty estimates for the parameters of the predictive model. Therefore, we have a set of predictions derived from different months (though with different confidence).
About
References
- Chen, Y., J. T. Randerson, D. C. Morton, R. S. DeFries, G. J. Collatz, P. S. Kasibhatla, L. Giglio, Y. Jin, M. E. Marlier, Forecasting fire season severity in South America using sea surface temperature anomalies, Science, 334, 787-791, 2011. [link]
- Chen Y., I. Velicogna, J. S. Famiglietti, and J. T. Randerson, Satellite observations of terrestrial water storage provide early warning information about drought and fire season severity in the Amazon, J. Geophys. Res. - Biogeosciences, 118, 1-10, 2013. [link]
- Chen, Y., J. T. Randerson, D. C. Morton, Y. Jin, G. J. Collatz, P. S. Kasibhatla, G. R. van der Werf, R. S. DeFries, Long-term trends and interannual variability of forest, savanna and agricultural fires in South America, Carbon Management. 4(6), 617-638. [link]
- de Linage, C., J. S. Famiglietti, and J. T. Randerson (2014), Statistical prediction of terrestrial water storage changes in the Amazon Basin using tropical Pacific and North Atlantic sea surface temperature anomalies, Hydrol Earth Syst Sc, 18(6), 2089-2102.[link]
- Chen, Y., J. T. Randerson, D. C. Morton (2015), Tropical North Atlantic ocean-atmosphere interactions synchronize forest carbon losses from hurricanes and Amazon fires, Geophysical Research Letters, 42(15), 6462-6470.[link]
- Chen, Y., D. C. Morton, N. Andela, L. Giglio, and J. T. Randerson (2016), How much global burned area can be forecast on seasonal time scales using sea surface temperatures? Environmental Research Letters, 11(4), 045001. [link]
Glossary
- FC : Active fire counts, defined as the number of fire/hotspots observed by satellite.
- AMO: Atlantic Multi-decadal Ossilation index, representing sea surface temperature anomaly in North Atlantic. We used 3-month mean of Kalplan SST anomalies in North Atlantic (0-70N). Data available at NOAA Earth System Research Laboratory website.
- Fire season: The fire season is defined here as the period from 4 months before the peak fire month to 4 months after the peak fire month.
- FSS: Fire season severity, defined as the sum of FC during the fire season (4 months before the peak fire month to 4 months after the peak fire month) for each year.
- FSSI: FSS index, a measure of FSS based on historical mean values and standard deviation in the same region. FSSI = 50*(1+ERF((FSS-FSSoavg)/sqrt(2)/FSSostd), where FSSoavg and FSSostd are mean and standard deviation of observed FSS during 2001-2010. ERF is the error function.
- MODIS: Moderate Resolution Imaging Spectroradiometer, an earth observation remote sensing instrument on board the Terra satellite and Aqua satellite.
- ONI: Ocean Niño Index, representing sea surface temperature anomaly in Eastern tropical Pacific. We used 3-month mean of ERSST.v3b SST anomalies in the Niño 3.4 region (5N-5S, 120-170W). Data available at NOAA Climate Prediction Center website.
- Terra: A NASA research satellite in a sun-synchronous orbit around the earth. It carries a payload of five remote sensors including MODIS.
Acknowledgements
This work is funded by the Gordon and Betty Moore Foundation through Grant GBMF3269 and the US Agency for International Development (USAID).
This work is the result of a collaboration between University of California, Irvine (Yang Chen and Jim Randerson), NASA Goddard Space Flight Center (Doug Morton Niels Andela, and James Collatz), Columbia Univeristy (Ruth DeFries and Miriam Marlier), University of Maryland (Louis Giglio), and Duke University (Prasad Kasibhatla).
NASA provided the satellite observations of fires and NOAA provided the sea surface temperature time series used in our analysis. The interactive figures and maps were generated using Google's Chart API , Maps API, and Fusion table API .
Doug Morton at NASA Goddard Space Flight Center and Pineda Llopart Serrano translated this forecast website to Portuguese and Spanish.
Disclaimer
The model predictions contained on this website are highly experimental. They cannot be used to predict the occurrence of individual fires. Use of this information for planning purposes should also draw upon other independent and reliable climate information sources. The Regents of The University of California will not be liable for any consequences that may occur if you rely on this information.