ESS210B
Prof. Jin-Yi Yu

Power
Spectrum
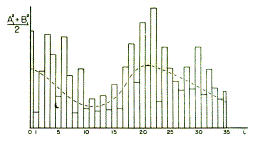
qBy plotting the amplitude of the harmonics as a function of k, we produce the “power spectrum” of the time series y.
qThe meaning of the spectrum is that it shows the contribution of each harmonic to the total variance.
qIf t is time, then we get the frequency spectrum.
qIf t is distance, then we get the wavenumber spectrum.


smooth spectrum
line spectrum
(Figure from
Panofsky and Brier 1968)