ESS210B
Prof. Jin-Yi Yu

Application in
Operational Climatology
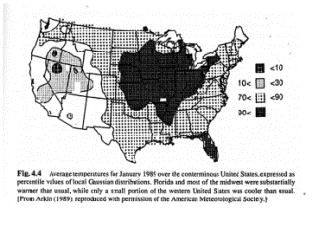
qThis figure shows
average temperatures for January 1989 over the US, expressed as quantiles of the local Normal distributions.
qDifferent values of m and s have been estimated
for each location.


-1.28
-0.53
0.53
1.28


Warmer than 9 out of 10 years
