|
1
|
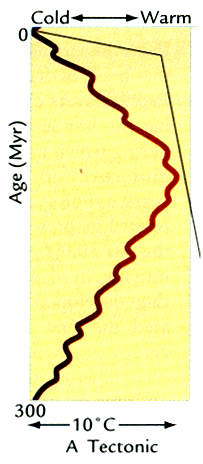
- Tectonic-Scale Climate Changes
- Orbital-Scale Climate Changes
- Deglacial and Millennial Climate Changes
- Historical Climate Changes
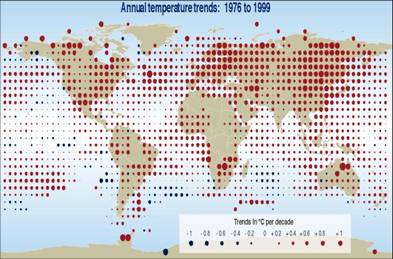
- Global Warming
|
|
2
|
|
|
3
|
|
|
4
|
|
|
5
|
- Tectonic-Scale Climate Changes
- Orbital-Scale Climate Changes
- Millennial Climate Changes
- Historical Climate Change
- Anthropogenic Climate Changes
|
|
6
|
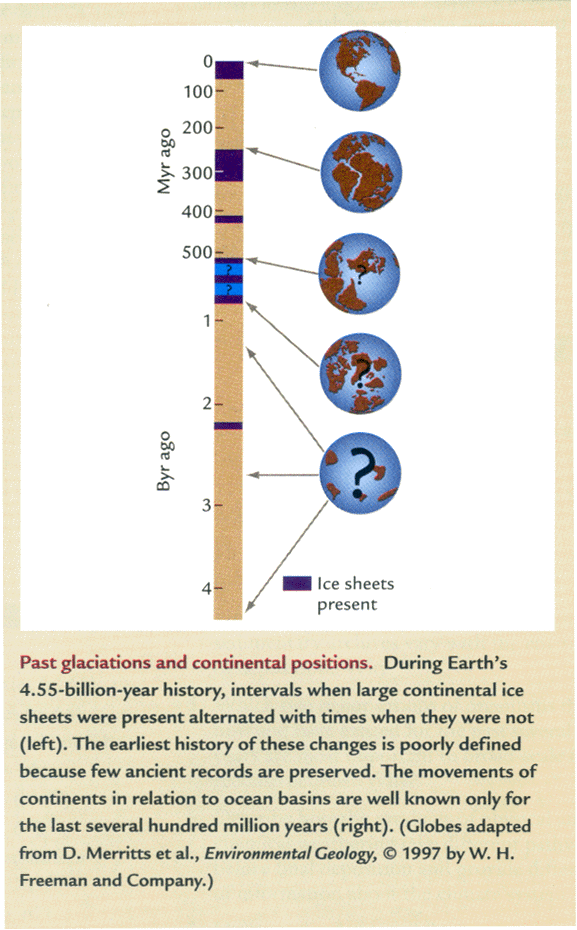
- The faint young Sun paradox and its possible explanation.
- Why was Earth ice-free even at the poles 100 Myr ago (the Mesozoic Era)?
- What are the causes and climate effects of changes in sea level through
time?
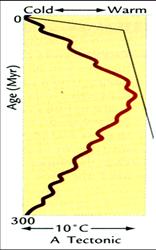
- What caused Earth’s climate to cool over the last 55 Myr (the Cenozoic
Era)?
|
|
7
|
|
|
8
|
|
|
9
|
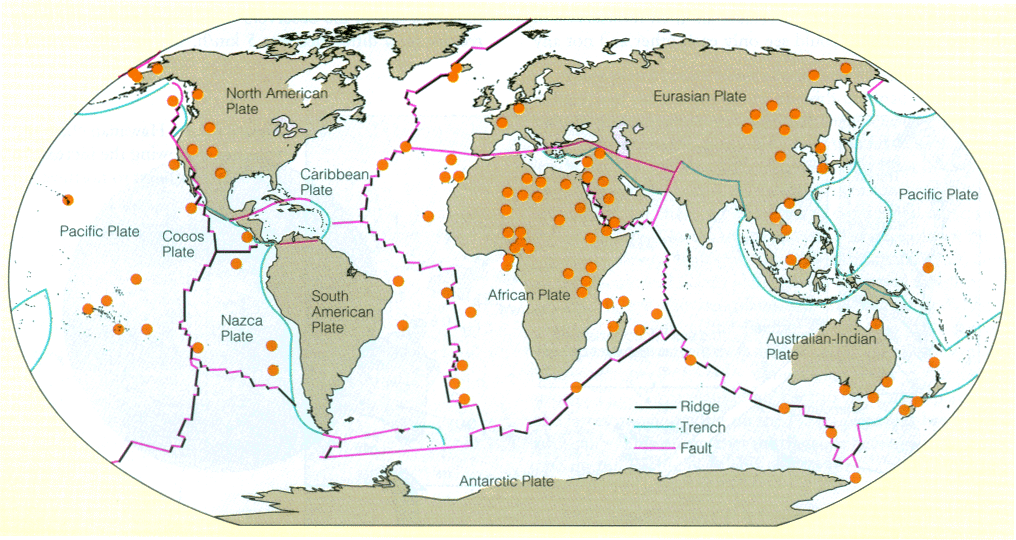
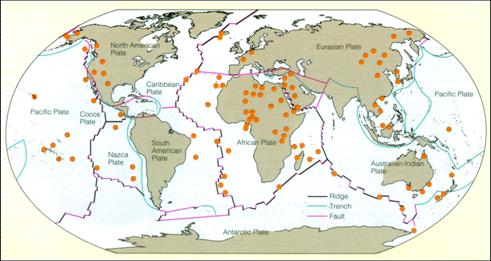
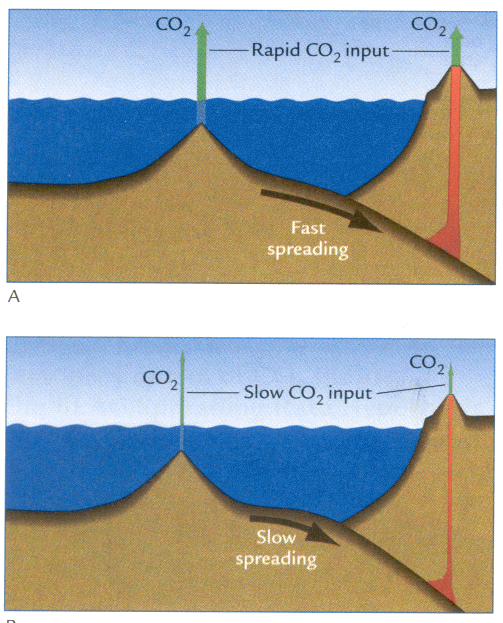
- During active plate tectonic processes, carbon cycles constantly between
Earth’s interior and its surface.
- The carbon moves from deep rock reservoirs to the surface mainly as CO2
gas associated with volcanic activity along the margins of Earth’s
tectonic plates.
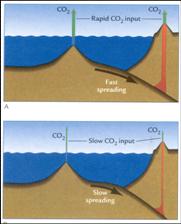
- The centerpiece of the seafloor spreading hypothesis is the concept that
changes in the rate of seafloor spreading over millions of years control
the rate of delivery of CO2 to the atmosphere from the large
rock reservoir of carbon, with the resulting changes in atmospheric CO2
concentrations controlling Earth’s climate.
|
|
10
|
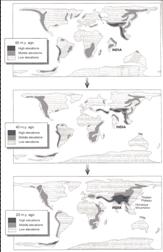
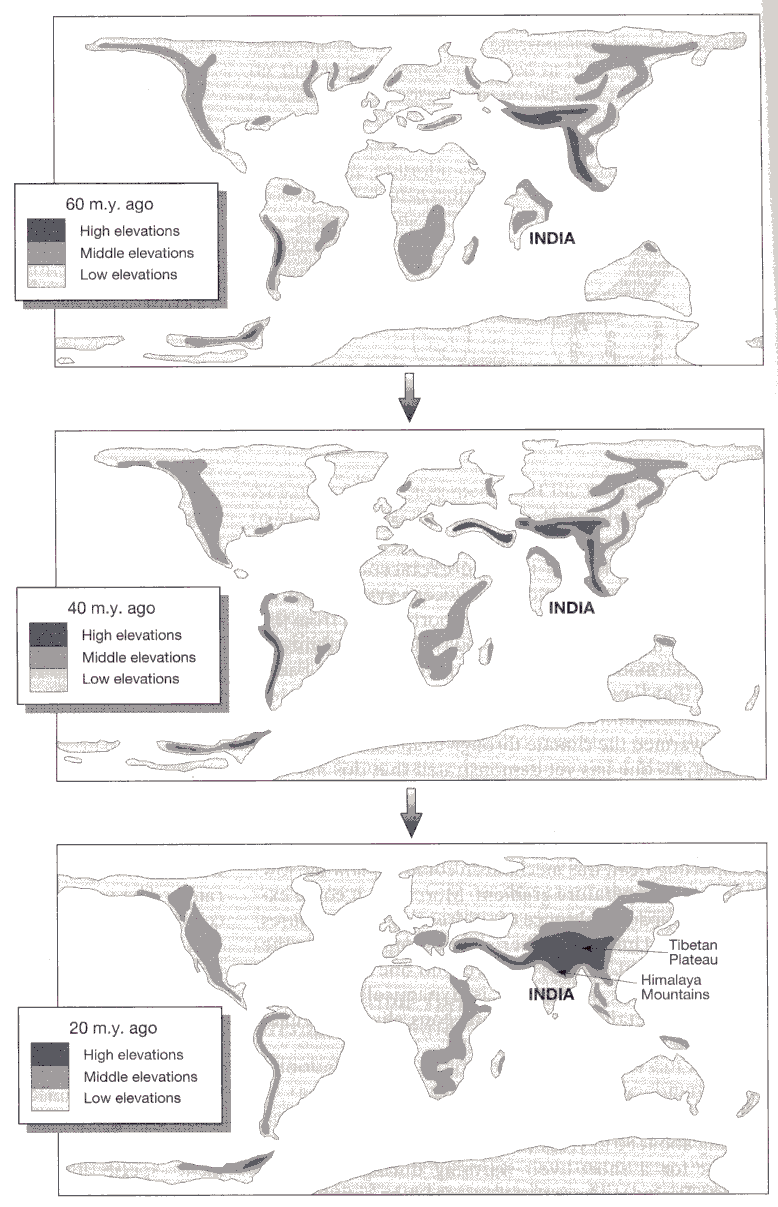
- The collision of Indian and Asia happened around 40 Myr ago.
- The collision produced the Himalayas and a huge area of uplifted terrain
called the Tibetan Plateau.
- The Himalayas Mountains provided fresh, readily erodable surfaces on
which chemical weathering could proceed rapidly.
- At the same time, the uplifting of the Tibetan Plateau create seasonal
monsoon rainfalls, which provided the water needed for chemical
weathering.
- Therefore, the collision of India and Asia enhanced the chemical
weathering process and brought down the atmospheric CO2 level to the
relatively low values that prevail today.
- This reduced the greenhouse effect and cooled down the climate over the
last 50 Myr.
|
|
11
|
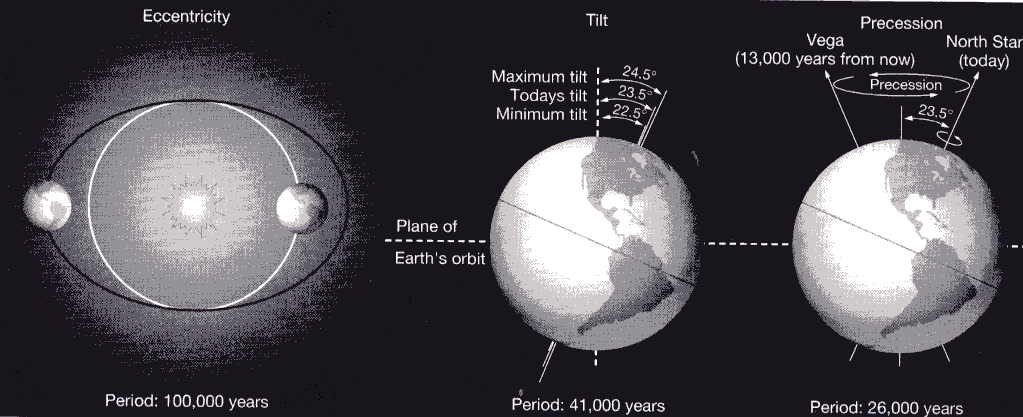
- Changes in solar heating driven by changes in Earth’s orbit are the
major cause of cyclic climate changes over time scales of tens to
hundreds of thousands of years (23k years, 41k years, and 100k years) .
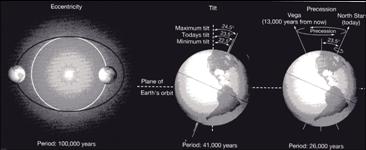
- Earth’s orbit and its cyclic variations: tilt variations, eccentricity
variations, and precession of the orbit.
- How do orbital variations drive the strength of tropical monsoons?
- How do orbital variations control the size of northern hemisphere ice
sheets?
- What controls orbital-scale fluctuations of atmospheric greenhouse
gases?
- What is the origin of the 100,000-year climate cycle of the last 0.9 Myr
(ice sheets melt rapidly every 100,000 years)?
|
|
12
|
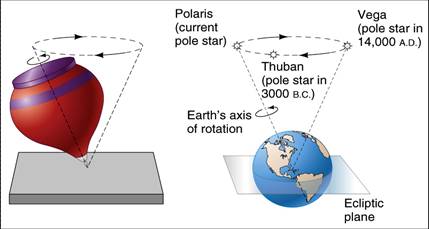
- First, Earth spins around on its axis once every day è The Tilt.
- Second, Earth revolves around the
Sun once a year è
The shape of the Orbit.
- Both the tilt and the shape of the orbit have changed over time and
produce three types of orbital variations:
- (1) obliquity variations
- (2) eccentricity variations
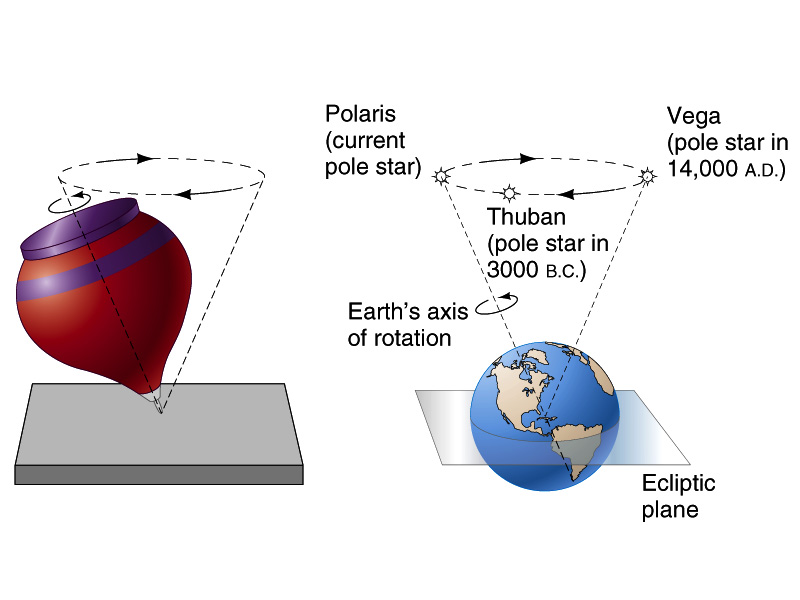
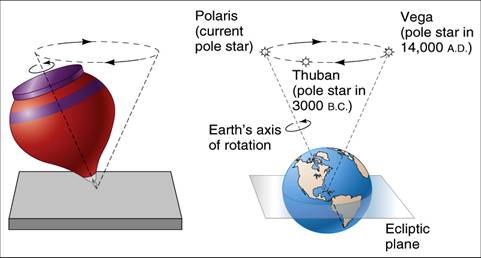
- (3) precession of the spin
axis.
|
|
13
|
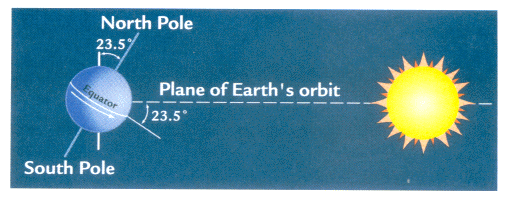
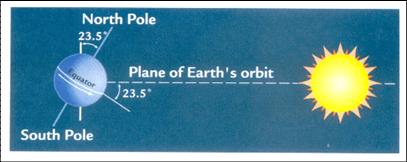
- At present-day, the axis is tilted at an angle of 23.5°, referred to as
Earth’s “obliquity”, or “tilt”.
- The Sun moves back and forth through the year between 23.5°N and 23.5°S.
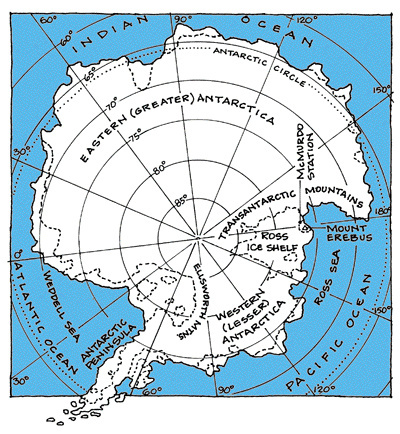
- Earth’s 23.5° tilt also defines the 66.5° latitude of the Artic and
Antarctic circles. No sunlight reaches latitudes higher than this in
winter day.
- The tilt produces seasons!!
|
|
14
|
|
|
15
|
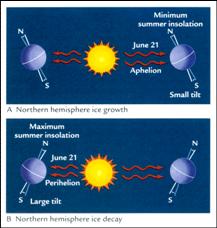
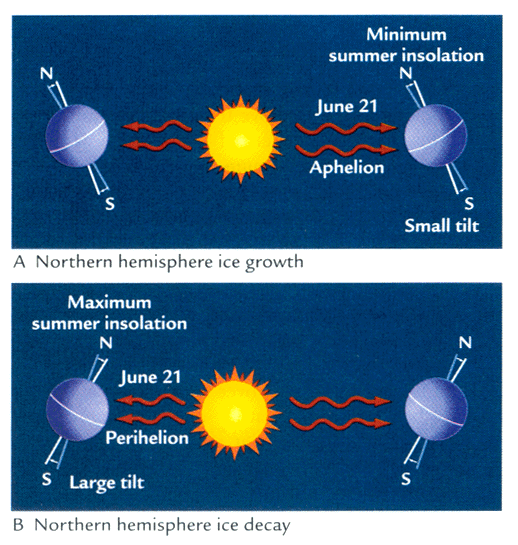
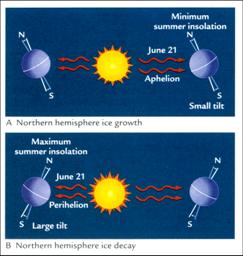
- Milankovitch suggested that the critical factor for Northern Hemisphere
continental glaciation was the amount of summertime insolation at high
northern latitudes.
- Low summer insolation occurs during times when Earth’s orbital tilt is
small.
- Low summer insolation also results from the fact that the northern
hemisphere’s summer solstice occurs when Earth is farthest from the Sun
and when the orbit is highly eccentric.
|
|
16
|
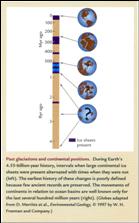
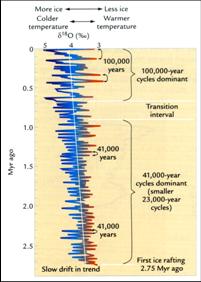
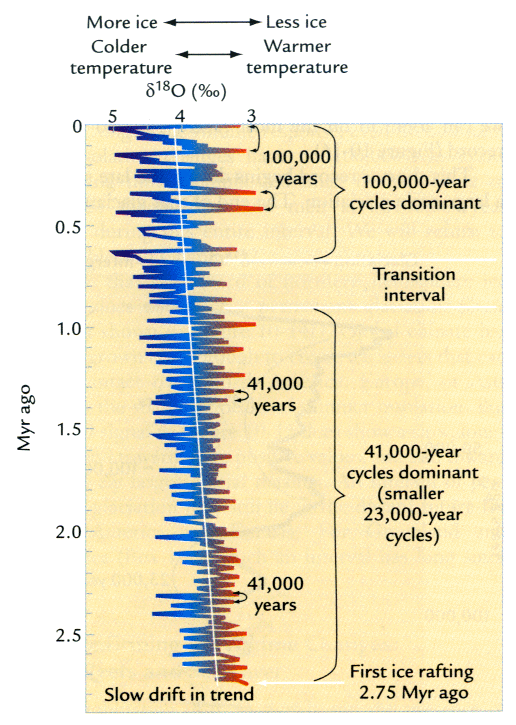
- This figures shows a North Atlantic Ocean sediment core holds a 3 Myr d18O record
of ice volume and deep-water temperature changes.
- There were no major ice sheets before 2.75 Myr ago.
- After that, small ice sheets grew and melted at cycles of 41,000 and
23,000 years until 0.9 Myr ago.
- After 0.9 Myr ago, large ice sheet grew and melted at a cycle of 100,000
years.
|
|
17
|
|
|
18
|
- Seasonal insolation levels 21,000 years ago were nearly identical to
those today.
- The only factors that can explain the colder and drier glacial maximum
climate 21,000 years ago are:
- (1) the large ice sheets
- (2) the lower values of
greenhouse gases.
|
|
19
|
|
|
20
|
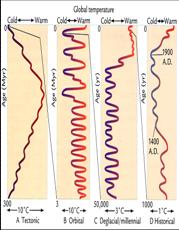
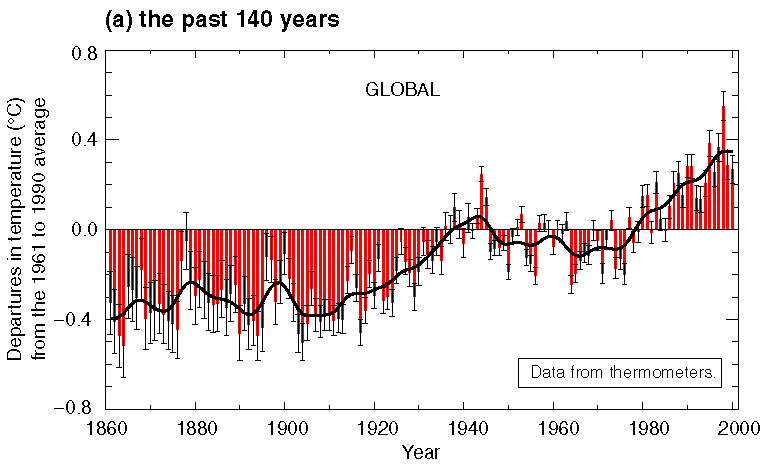
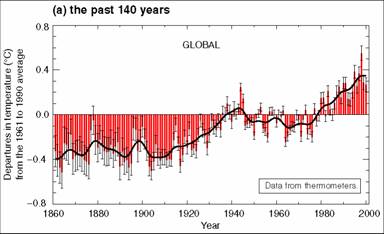
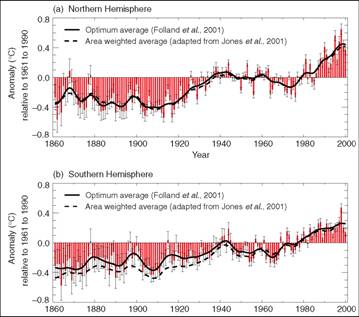
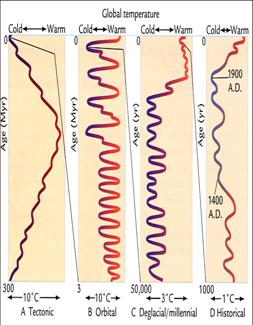
- Climate changes over the last 1000 years have been smaller than those
over tectonic, orbital, and glacial-age millennial time scales, never
exceeding 1°C on a global basis.
- Climate changes over the last several thousand years have been highly
variable in pattern from region to region.
|
|
21
|
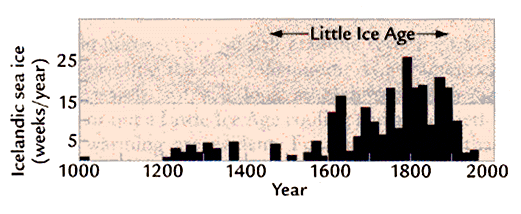
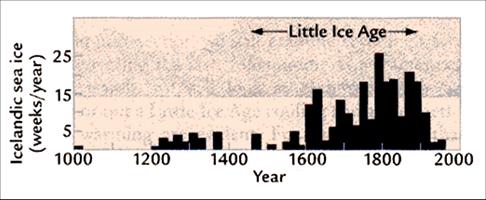
- Medieval Warming: A relatively warm climate near 1000 to 1300.
- Little Ice Age: The cooling during 1400-1900 that seriously affect
Europe.
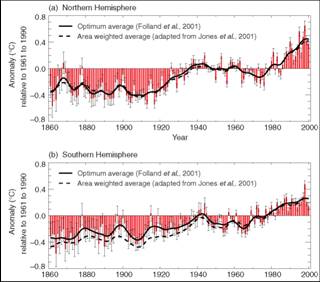
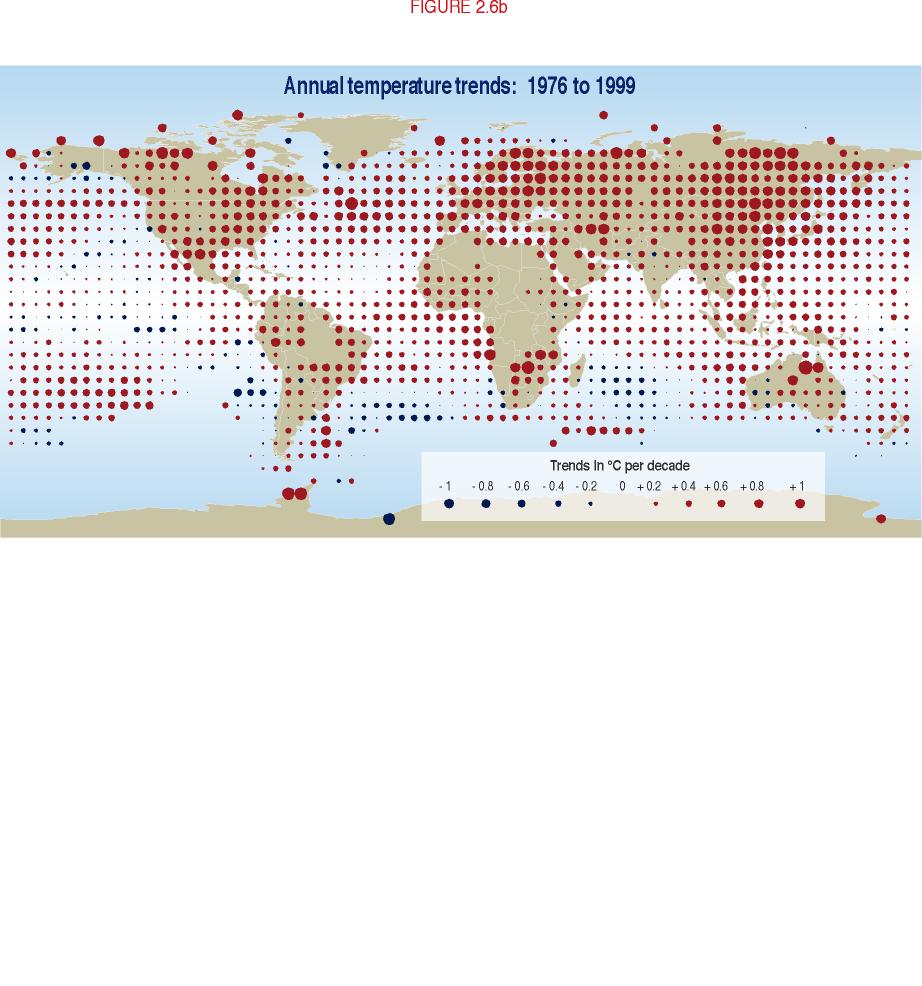
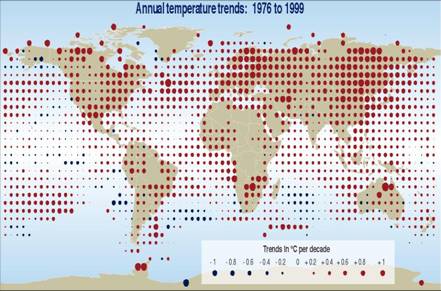
- Twentieth-Century Warming
|
|
22
|
|
|
23
|
|
|
24
|
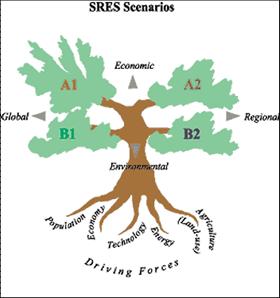
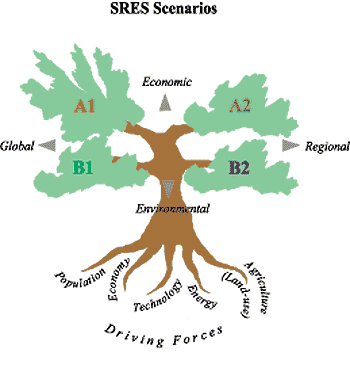
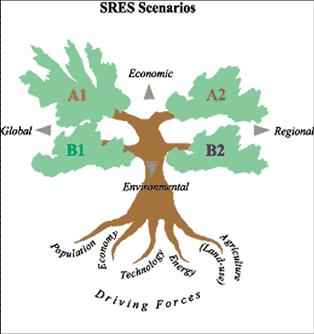
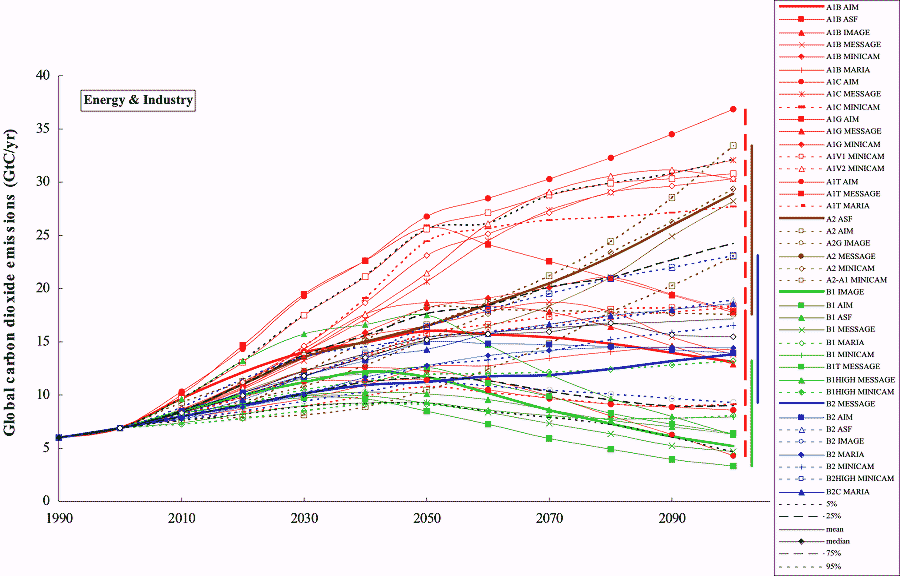
- The A1 story line is split into 4 scenarios which each are modeled in
different ways.
- There is an energy intensive A1 group called A1T, an oil and gas
resource focused A1 called A1G, a coal based A1 resource A1C, or a mix
of resources which was called A1B.
|
|
25
|
- The AR4 scenarios were bases on three scenarios: A2 (high emission), A1B
(medium emission), and B1 (low emission).
|
|
26
|
- http://www.grida.no/climate/ipcc/emission/5-2.htm
|
|
27
|
|
|
28
|
|
|
29
|
|
|
30
|
|
|
31
|
|
|
32
|
|
|
33
|
|
|
34
|
|
|
35
|
|
|
36
|
|
|
37
|
|
|
38
|
|
|
39
|
|
|
40
|
|
|
41
|
|
|
42
|
|
|
43
|
|
|
44
|
|
|
45
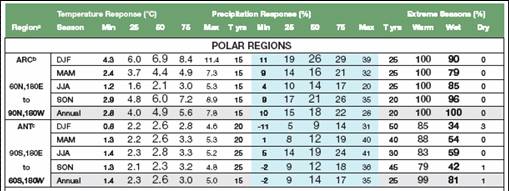
|
- AOGCM simulations;
- Downscaling of AOGCM-simulated data using techniques to enhance regional
detail;
- Physical understanding of the processes governing regional responses;
- Recent historical climate change.
|
|
46
|
|
|
47
|
|
|
48
|
|
|
49
|
|
|
50
|
|
|
51
|
|
|
52
|
|
|
53
|
|
|
54
|
|
|
55
|
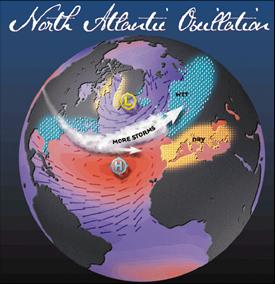
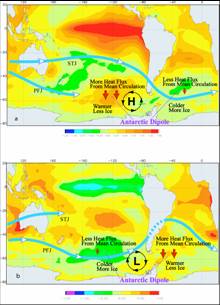
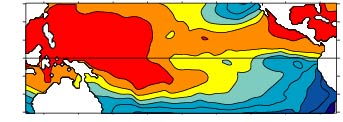
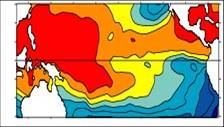
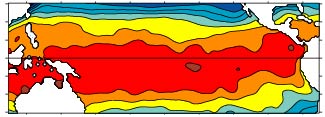
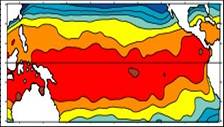
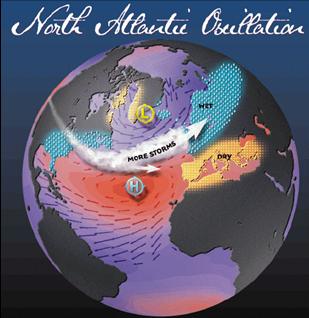
- The NAO is the dominant mode of winter climate variability in the North
Atlantic region ranging from central North America to Europe and much
into Northern Asia.
- The NAO is a large scale seesaw in atmospheric mass between the
subtropical high and the polar low.
- The corresponding index varies from year to year, but also exhibits a
tendency to remain in one phase for intervals lasting several years.
|
|
56
|
|
|
57
|
|
|
58
|
|
|
59
|
|
|
60
|
|
|
61
|
|
|
62
|
|
|
63
|
|
|
64
|
|
|
65
|
|

 Notes
Notes