ESS124
Prof.
Jin-Yi Yu
The Station Model: Pressure Tendency
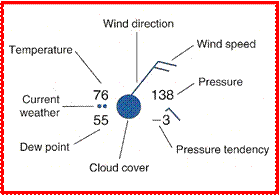

qThe change in surface pressure in the past three hours is plotted numerically and graphically on the lower right of the station model.
The pressure rose and then fell over
the past three hours, a total change
of 0.3 mb.