
ESS124
Prof.
Jin-Yi Yu
Skew-T/Log P Diagram
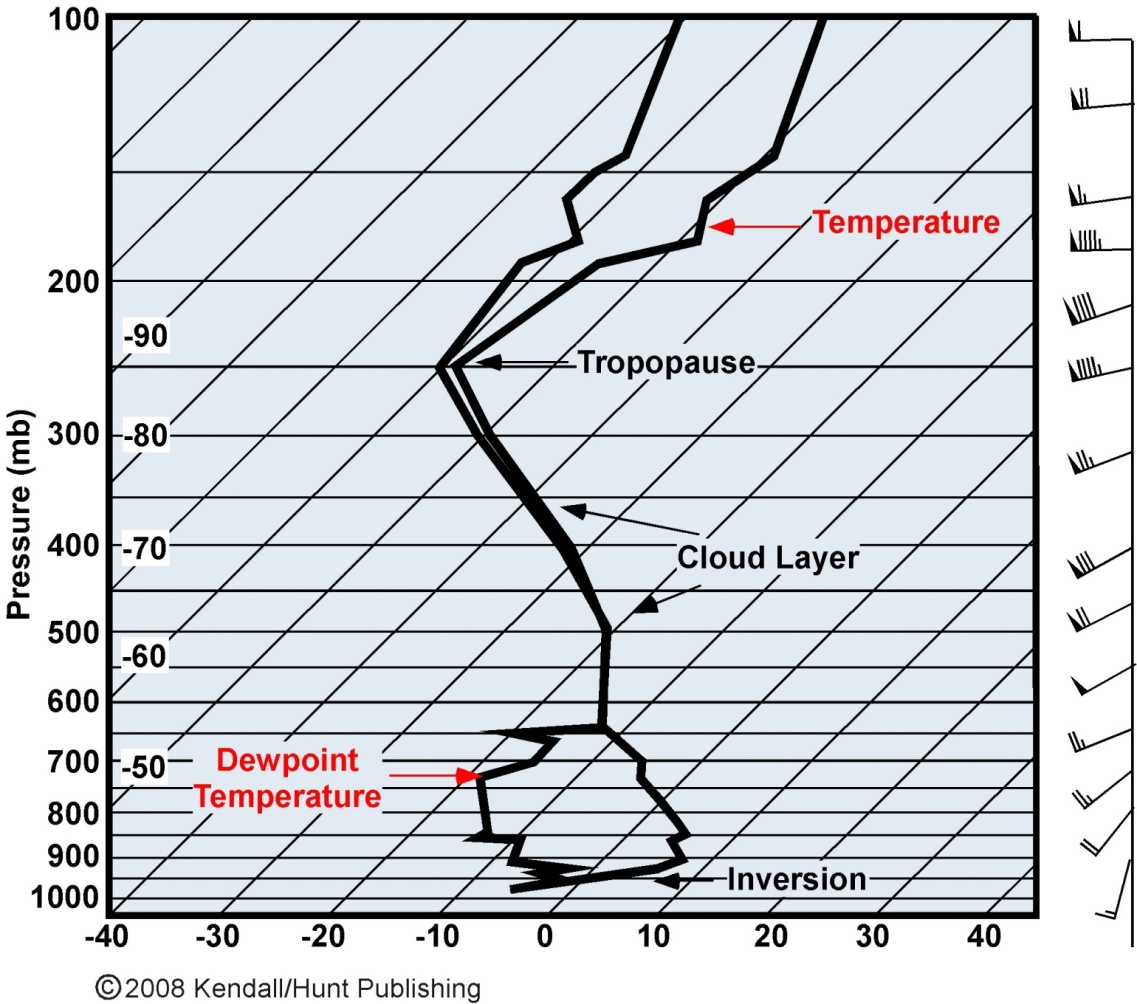
•Another way to display the vertical structure from sounding is the Skew-T/Log P Diagram.
•Lines of constant temperature are not vertical but skewed on this diagram.
•The is the most common diagram used in meteorology to plot soundings.