|
1
|
|
|
2
|
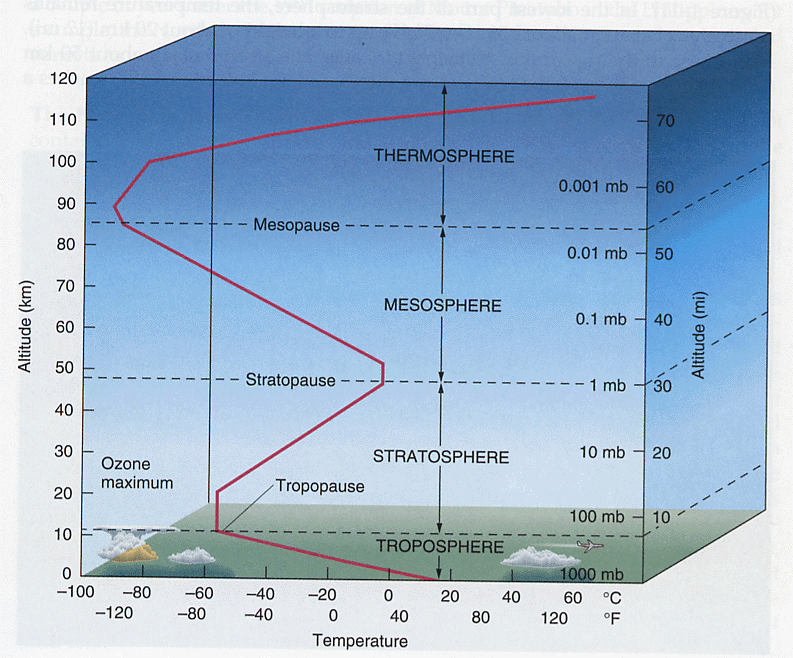
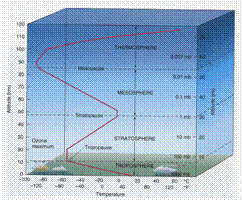
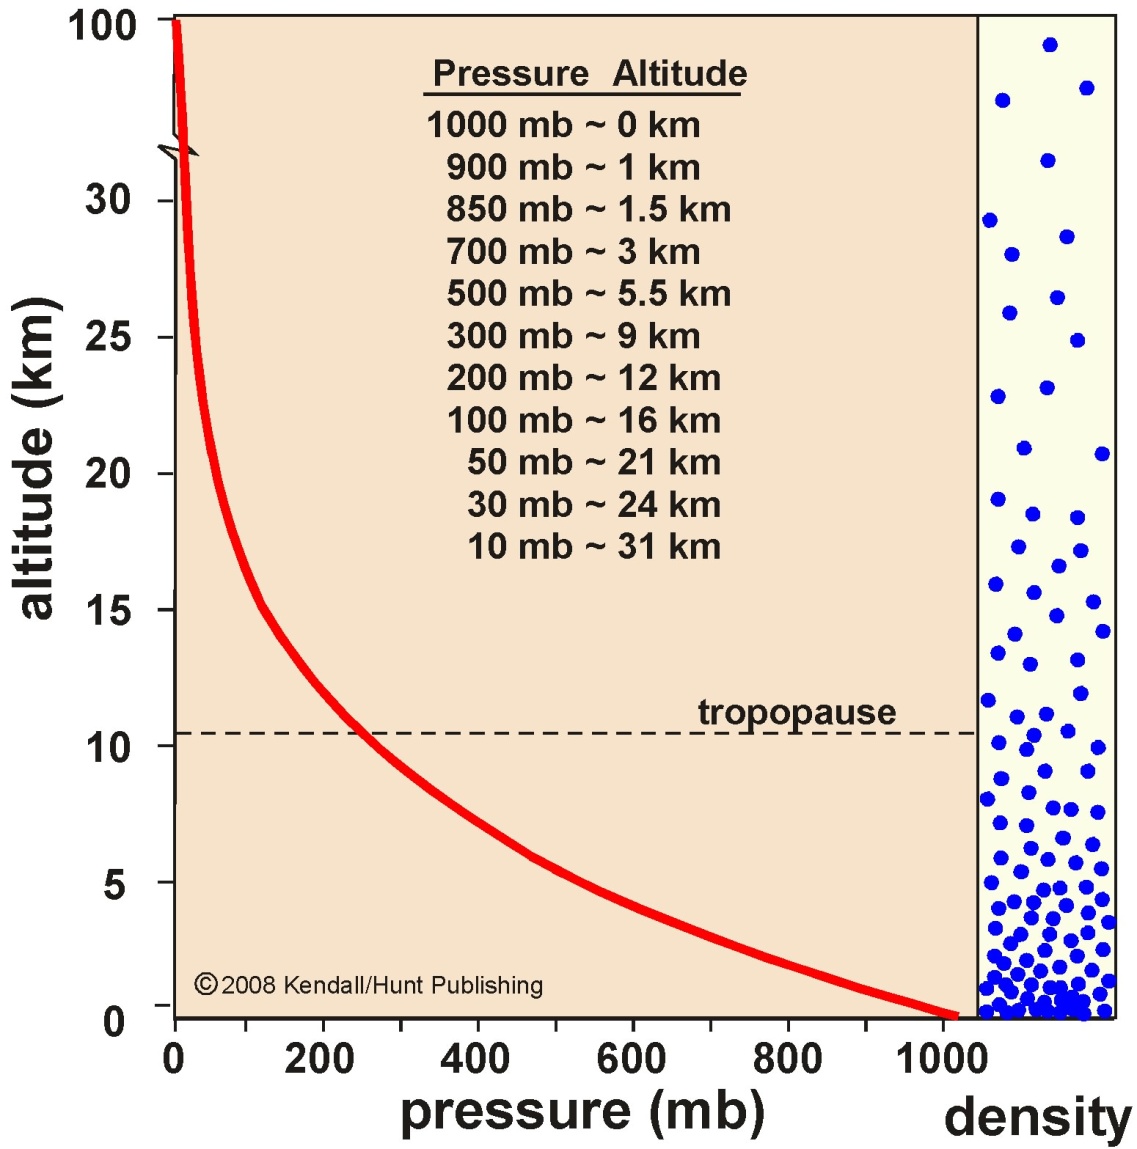
- The thickness of the atmosphere is only about 2% of Earth’s thickness
(Earth’s radius = ~6400km).
- Most of the atmospheric mass is confined in the lowest 100 km above the
sea level.
|
|
3
|
|
|
4
|
|
|
5
|
|
|
6
|
|
|
7
|
|
|
8
|
|
|
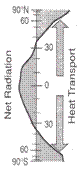
9
|
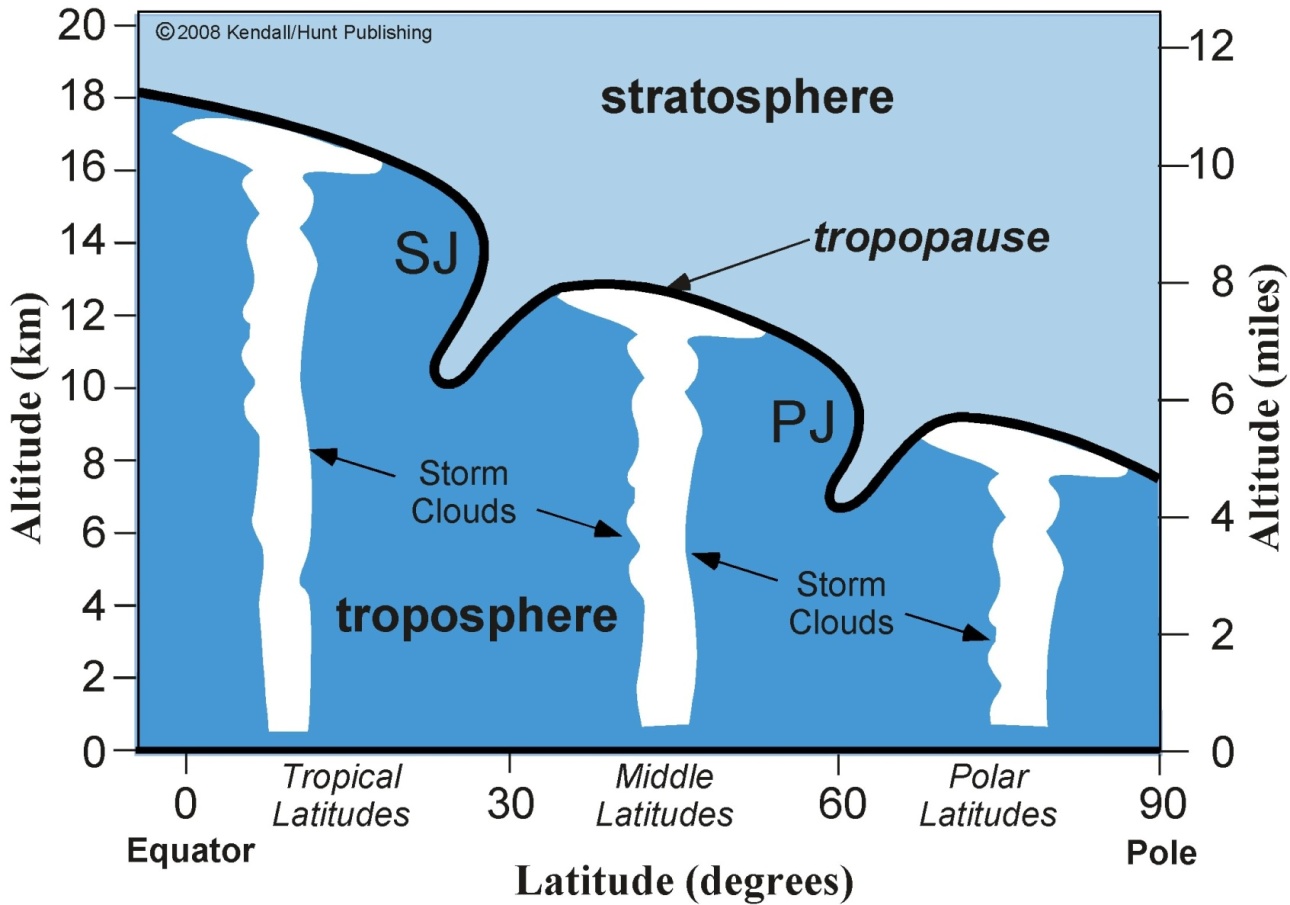
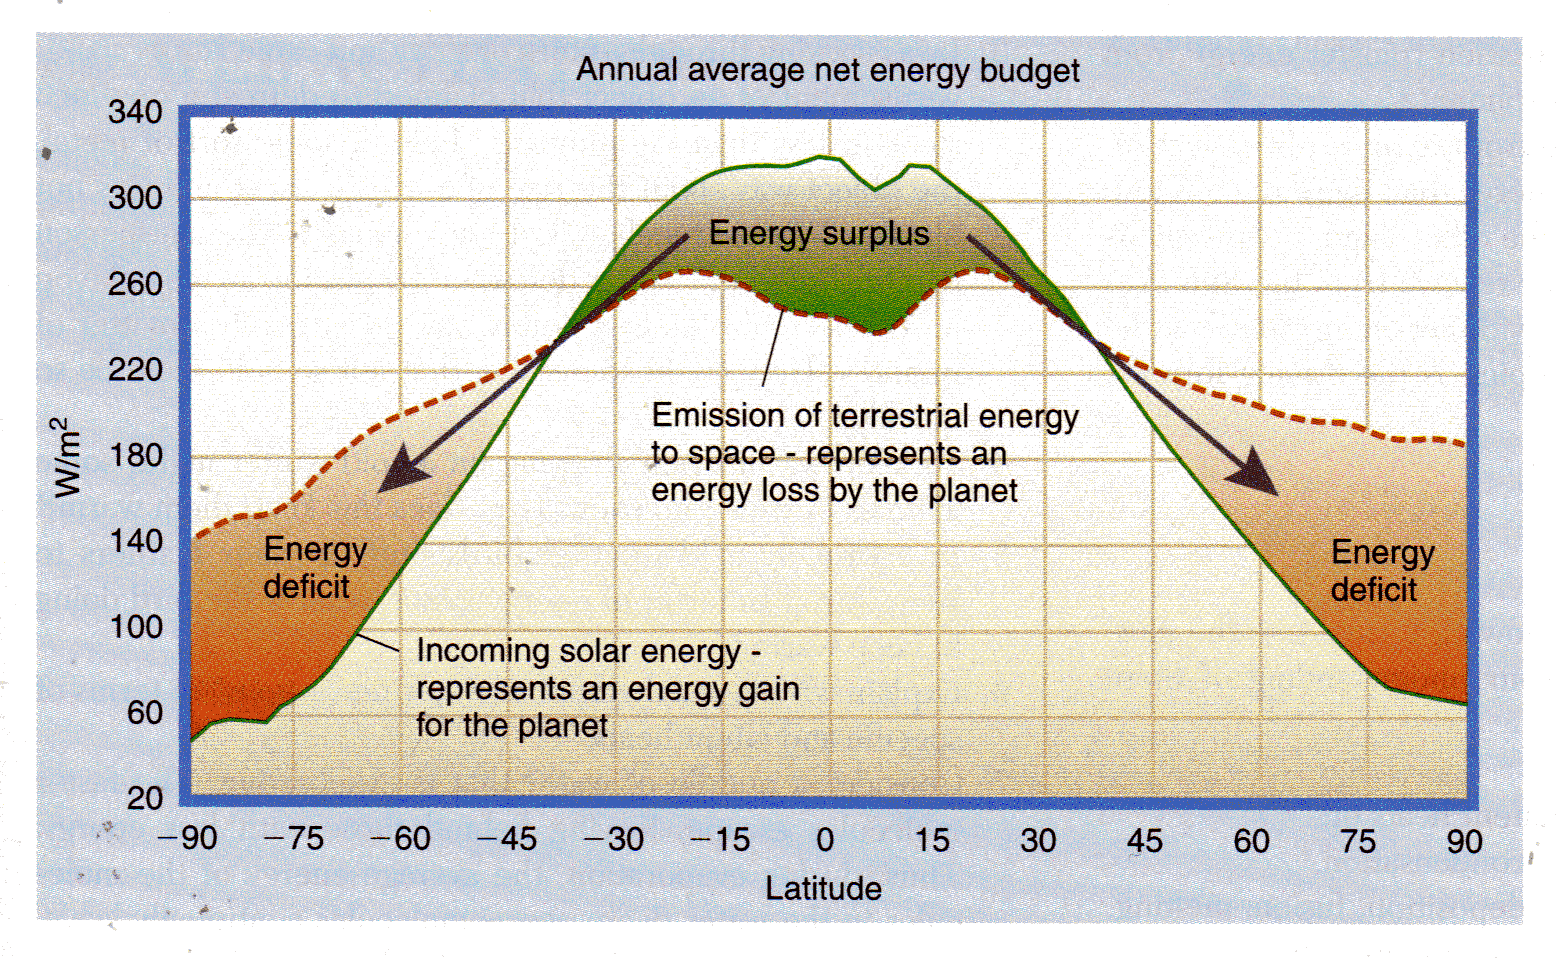
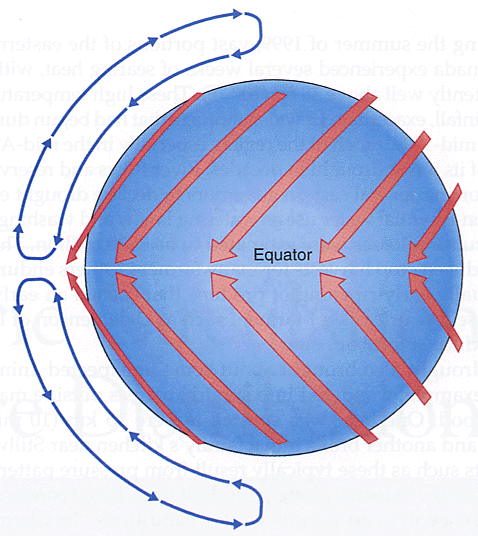
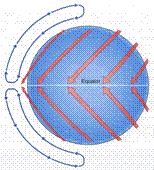
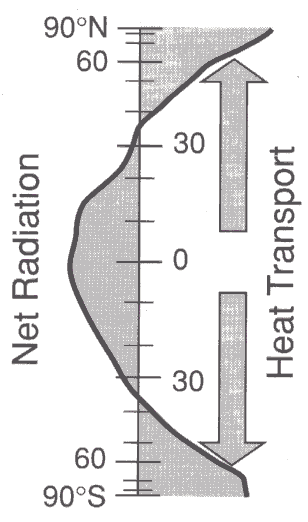
- Polarward heat flux is needed to transport radiation energy from the
tropics to higher latitudes.
|
|
10
|
|
|
11
|
|
|
12
|
|
|
13
|
|
|
14
|
|
|
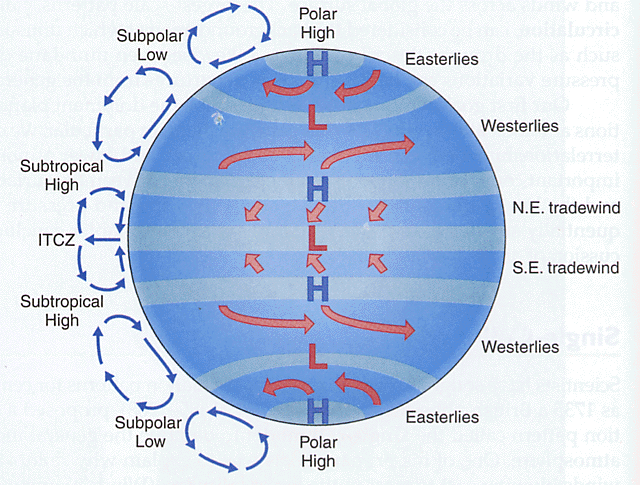
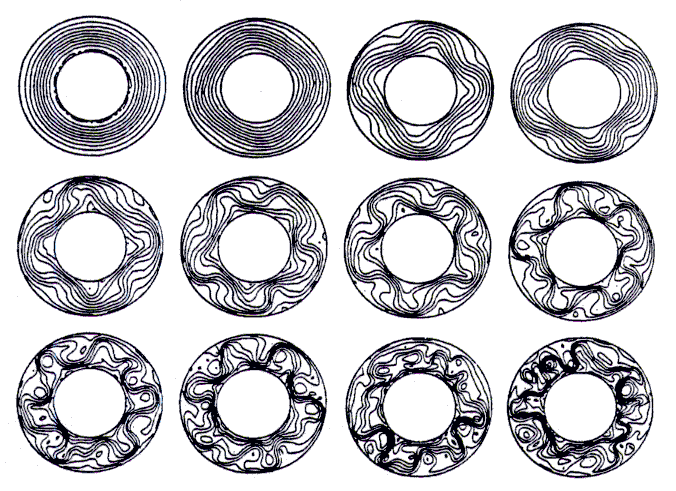
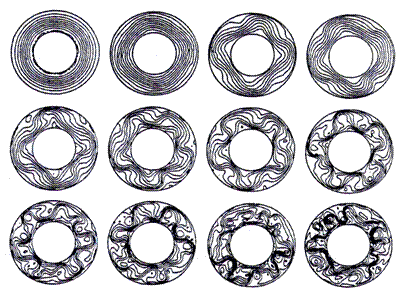
15
|
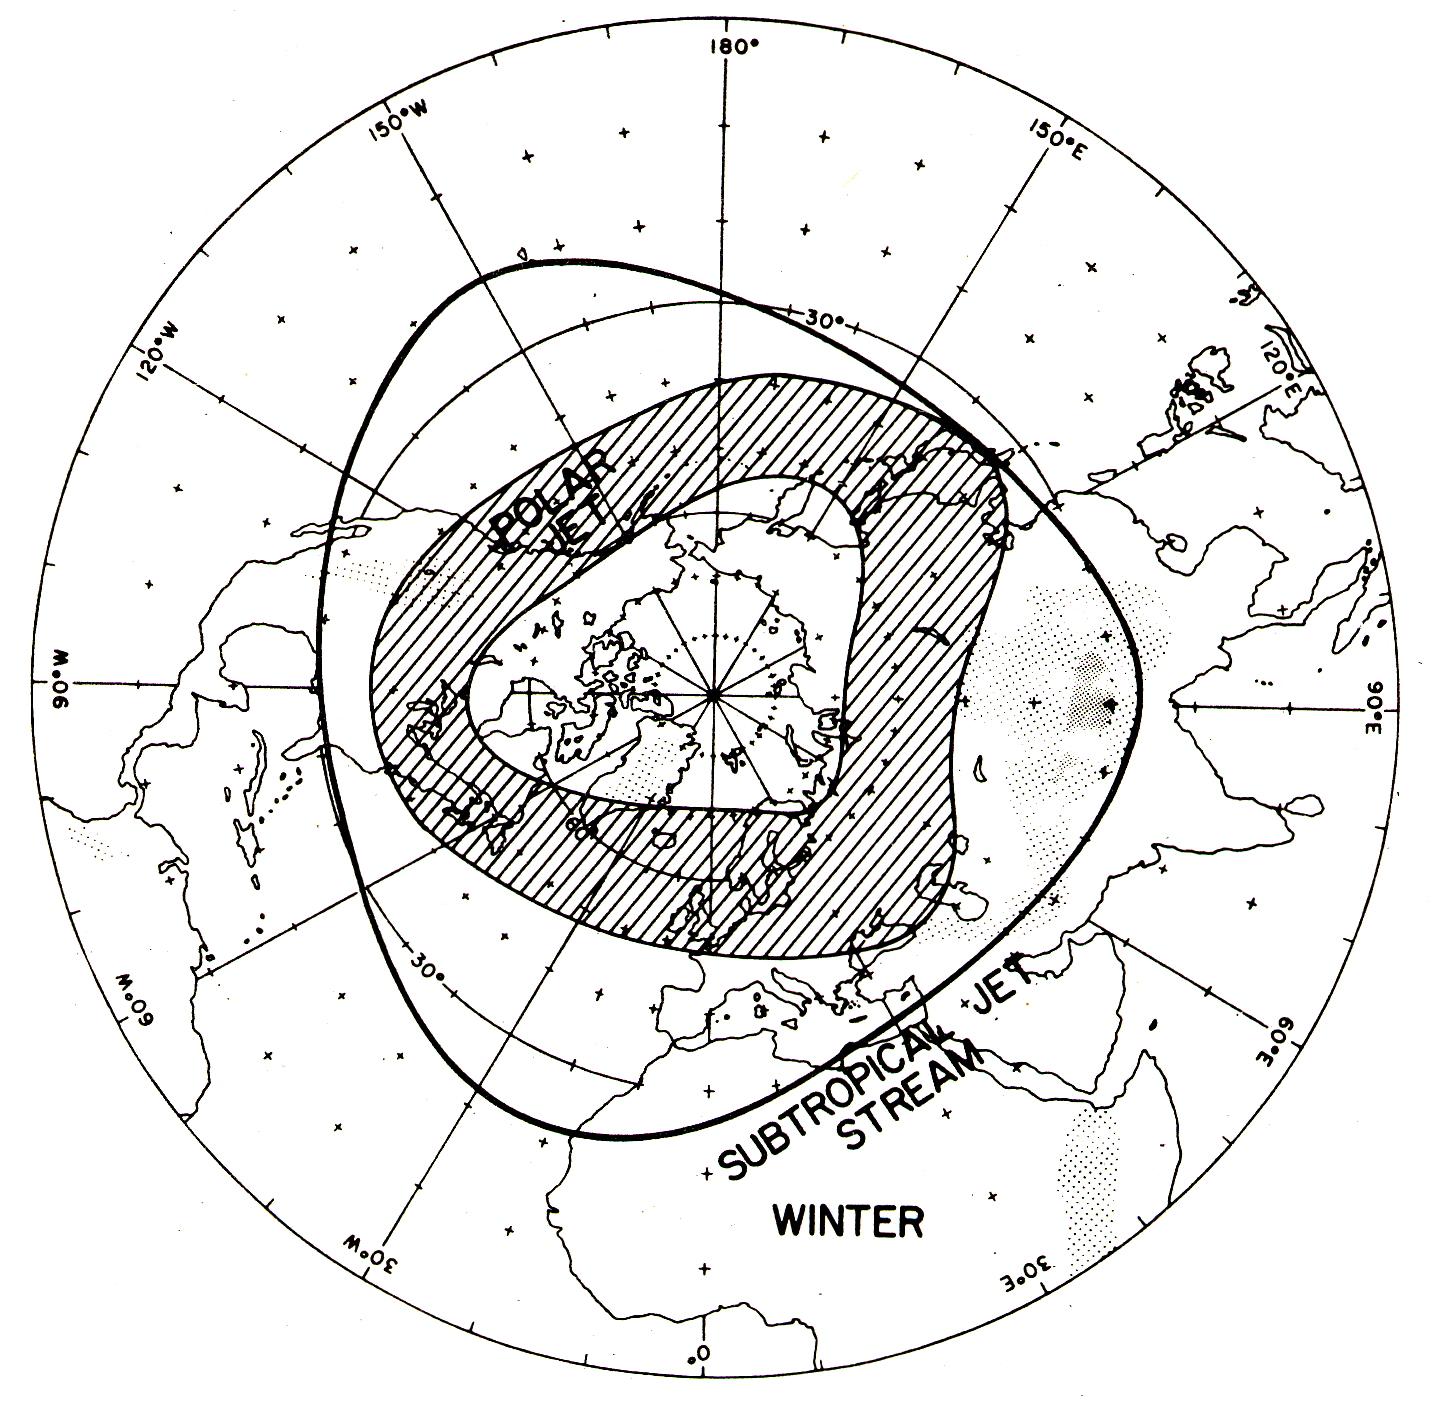
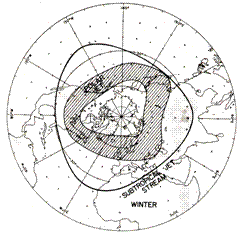
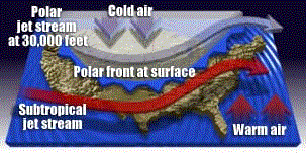
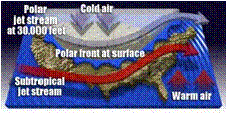
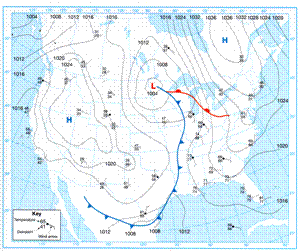
- Carl Rossby mathematically expressed relationships between mid-latitude
cyclones and the upper air during WWII.
- Mid-latitude cyclones are a large-scale waves (now called Rossby waves)
that grow from the “baroclinic” instabiloity associated with the
north-south temperature differences in middle latitudes.
|
|
16
|
|
|
17
|
- Pascal (Pa): a SI (Systeme
Internationale) unit for air pressure.
- 1 Pa = a force of 1 newton
acting on a surface of one square
- meter
- 1 hectopascal (hPa) = 1
millibar (mb) [hecto = one
hundred =100]
- Bar: a more popular unit for air pressure.
- 1 bar = a force of 100,000
newtons acting on a surface of one
- square meter
- = 100,000 Pa
- = 1000 hPa
- = 1000 mb
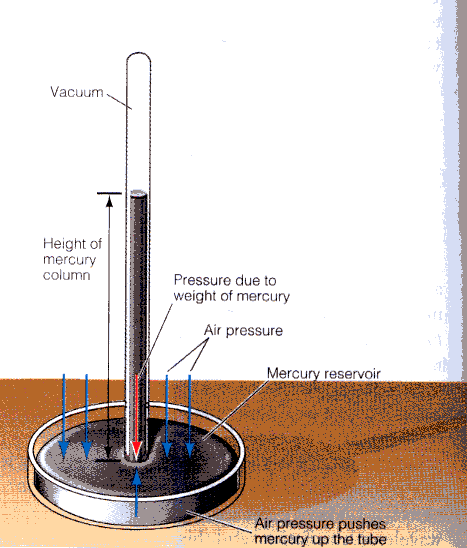
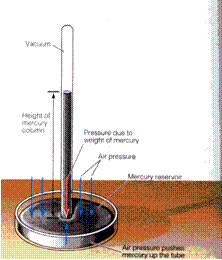
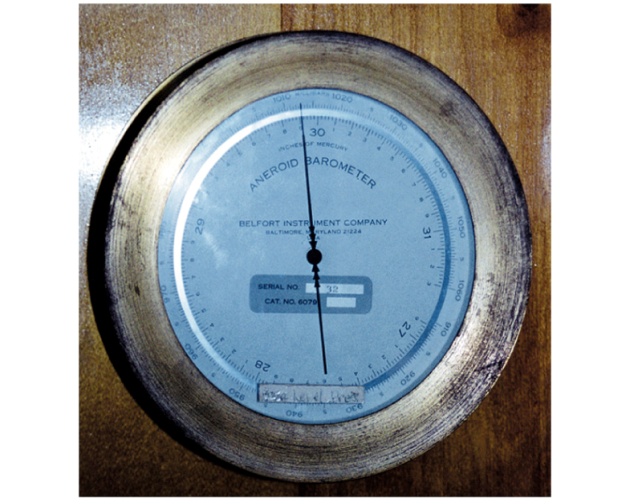
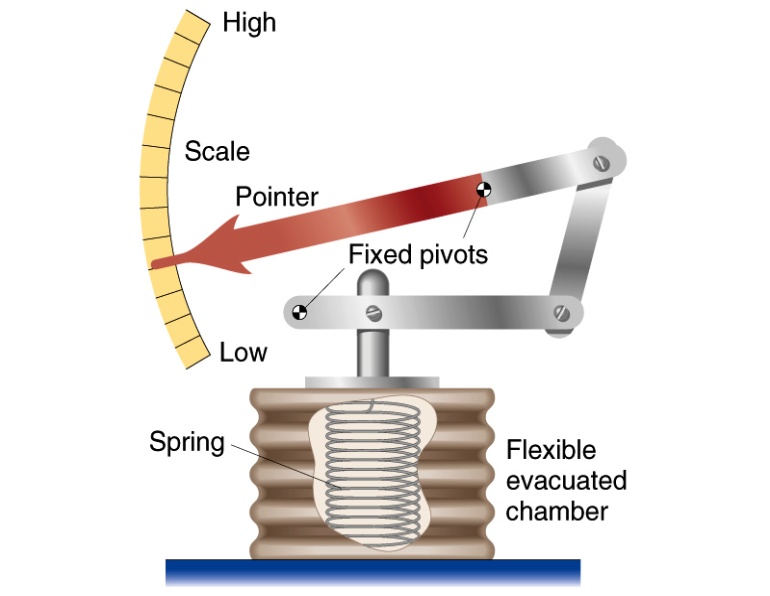
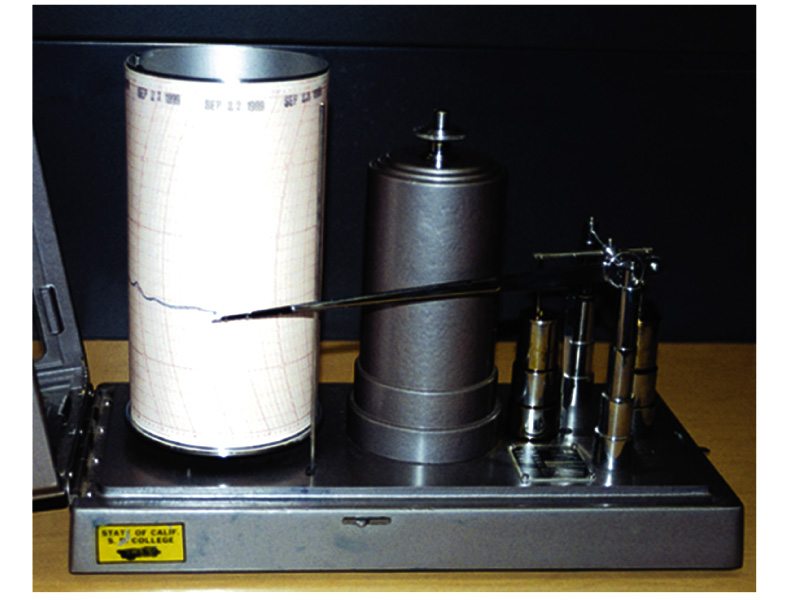
- One atmospheric pressure = standard value of atmospheric pressure at lea
level = 1013.25 mb = 1013.25 hPa.
|
|
18
|
|
|
19
|
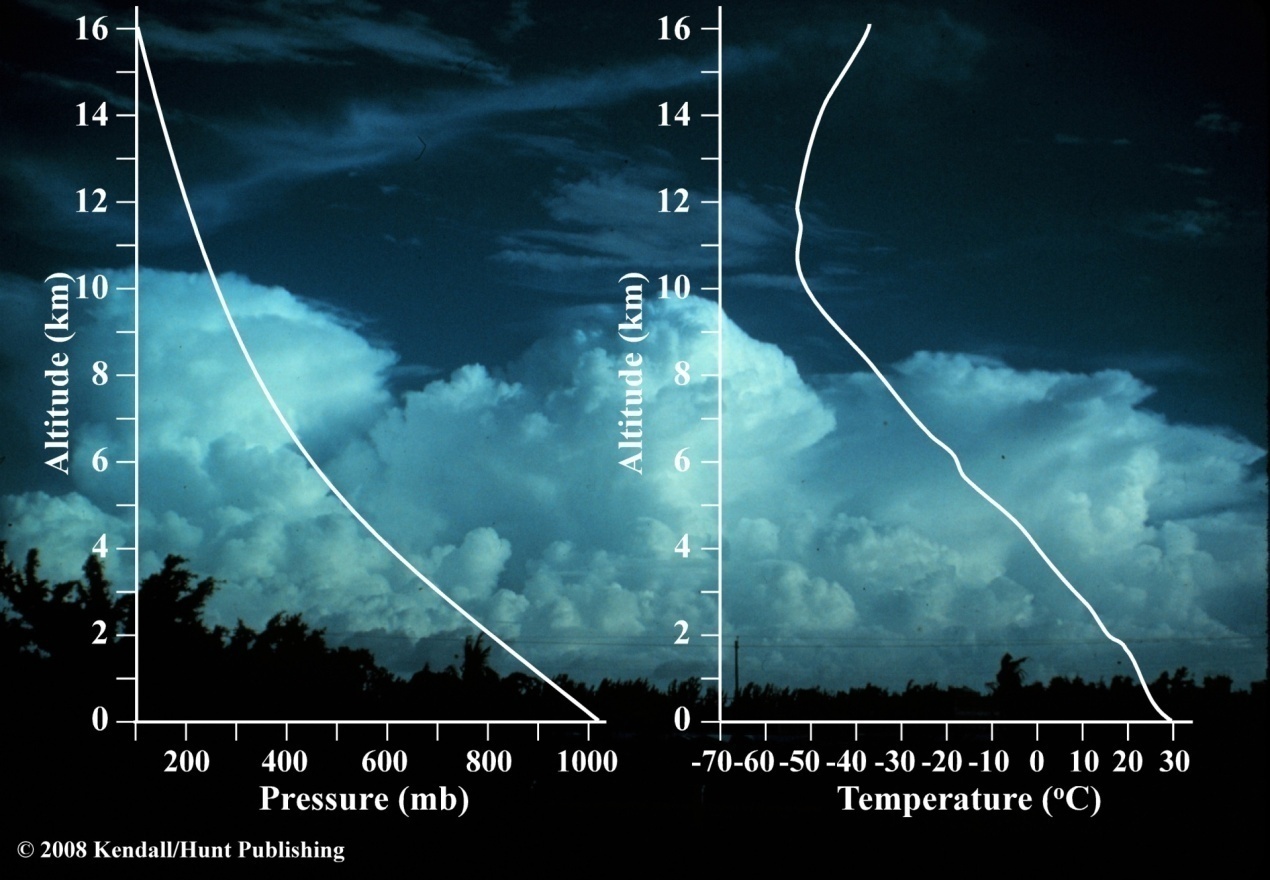
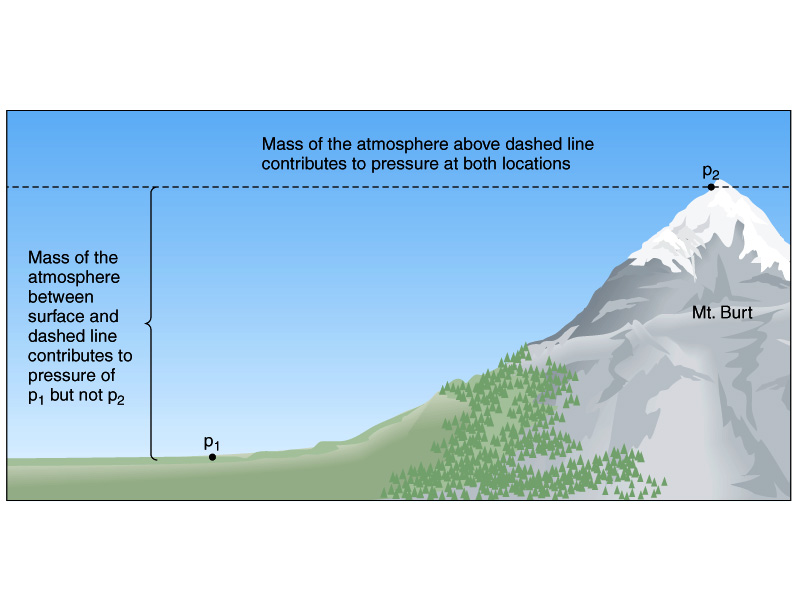
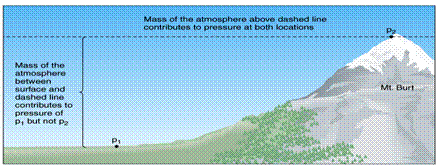
- Pressure decreases with height.
- Recording actual pressures may be misleading as a result.
- All recording stations are reduced to sea level pressure equivalents to
facilitate horizontal comparisons.
- Near the surface, the pressure decreases about 100mb by moving 1km
higher in elevation.
|
|
20
|
|
|
21
|
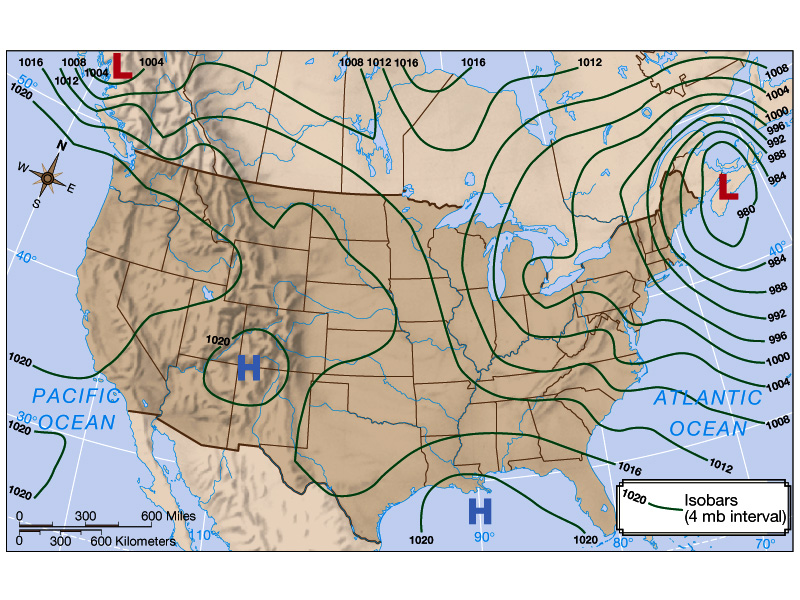
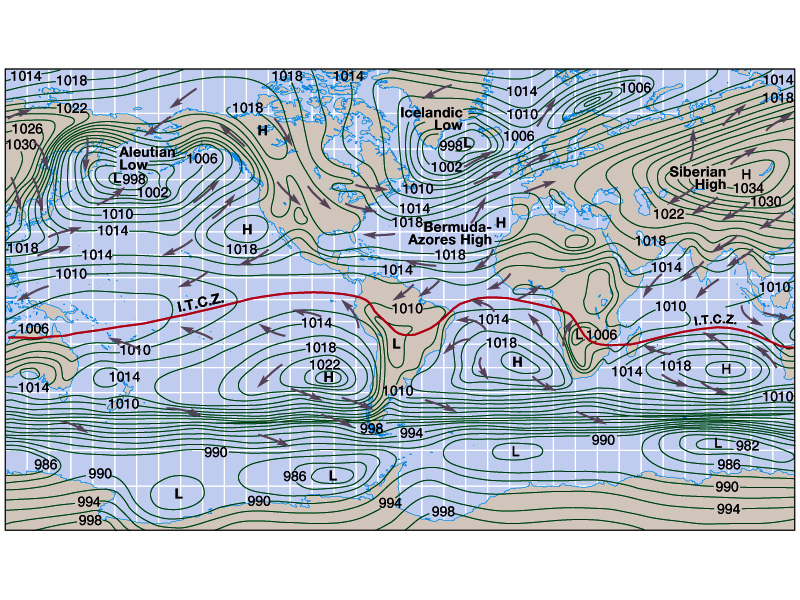
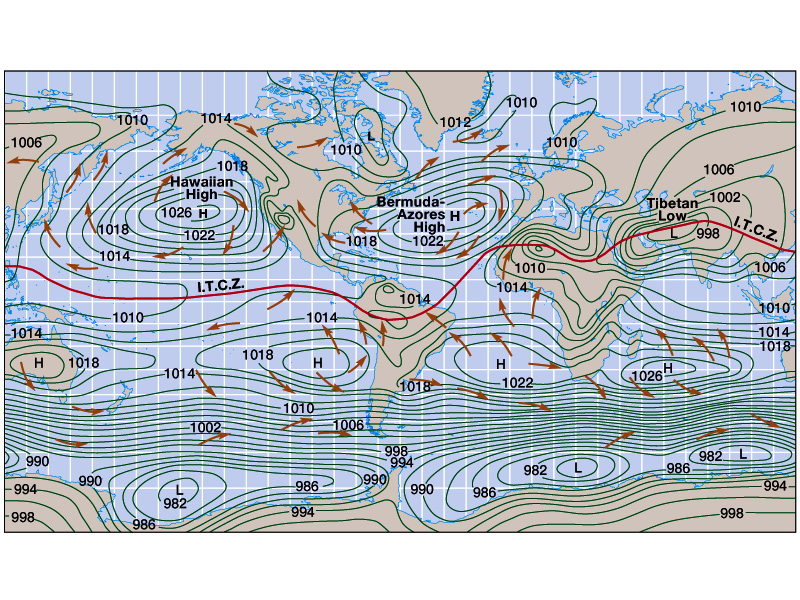
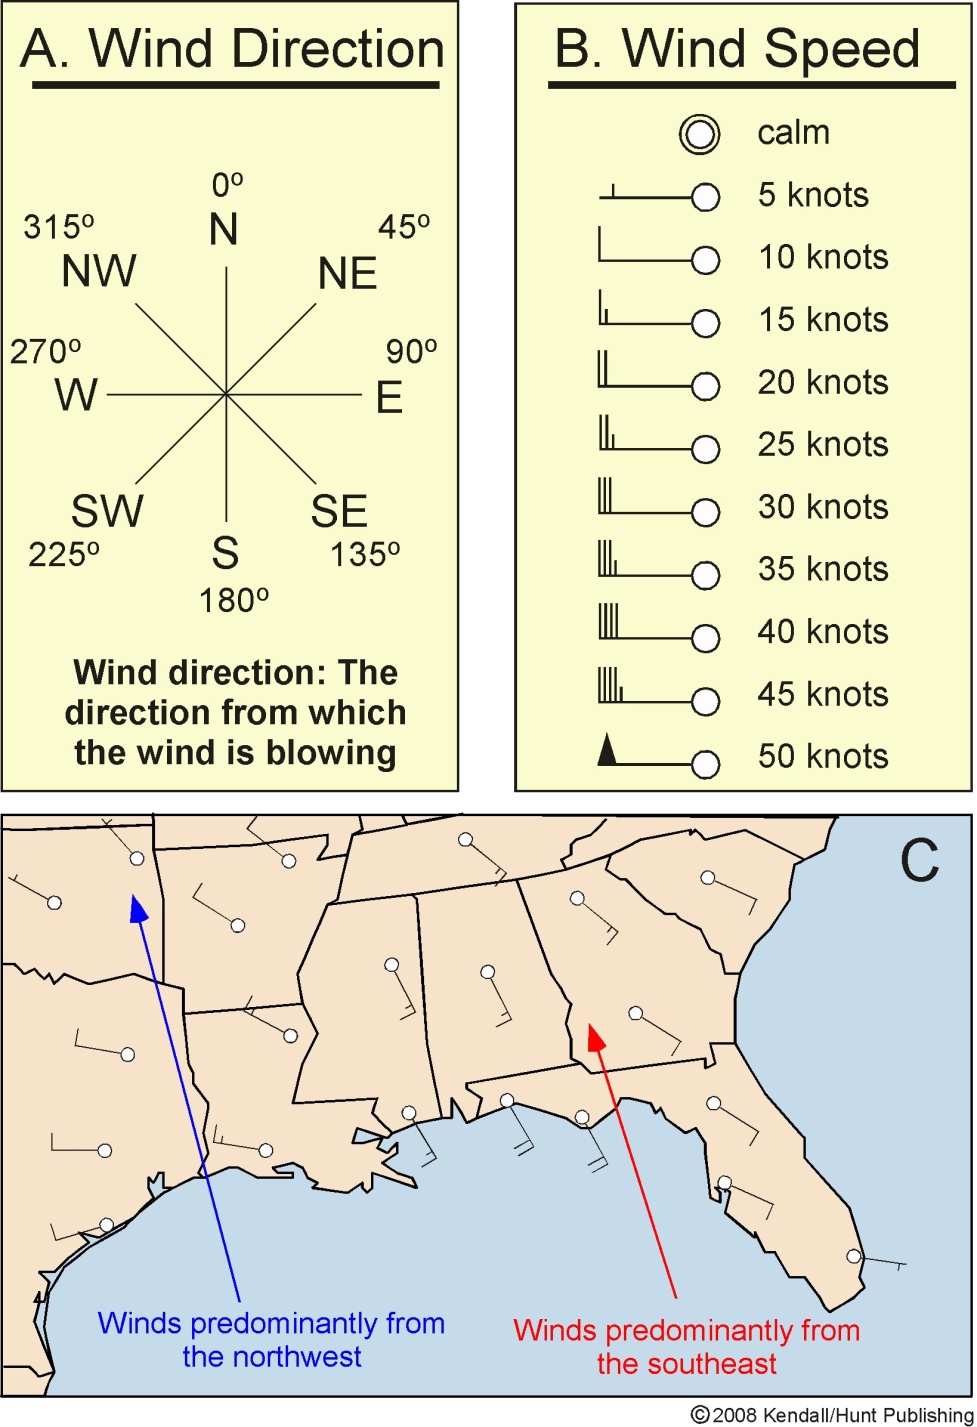
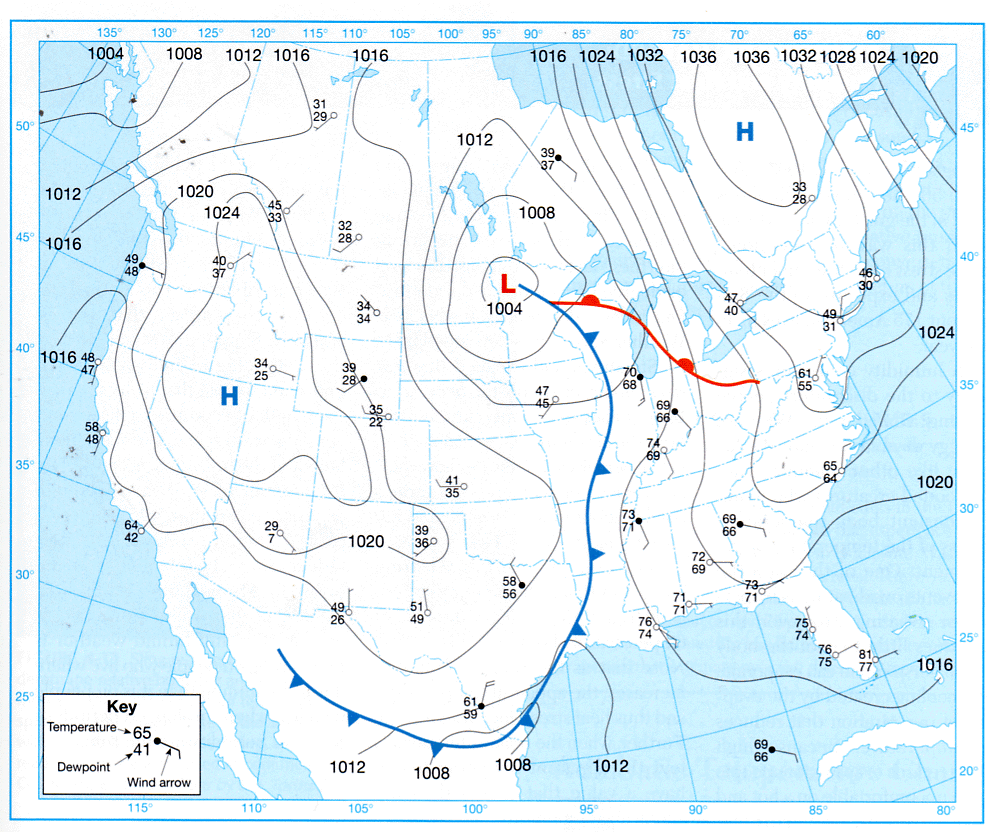
- It is useful to examine horizontal pressure differences across space.
- Pressure maps depict isobars, lines of equal pressure.
- Through analysis of isobaric charts, pressure gradients are apparent.
- Steep (weak) pressure gradients are indicated by closely (widely) spaced
isobars.
|
|
22
|
|
|
23
|
|
|
24
|
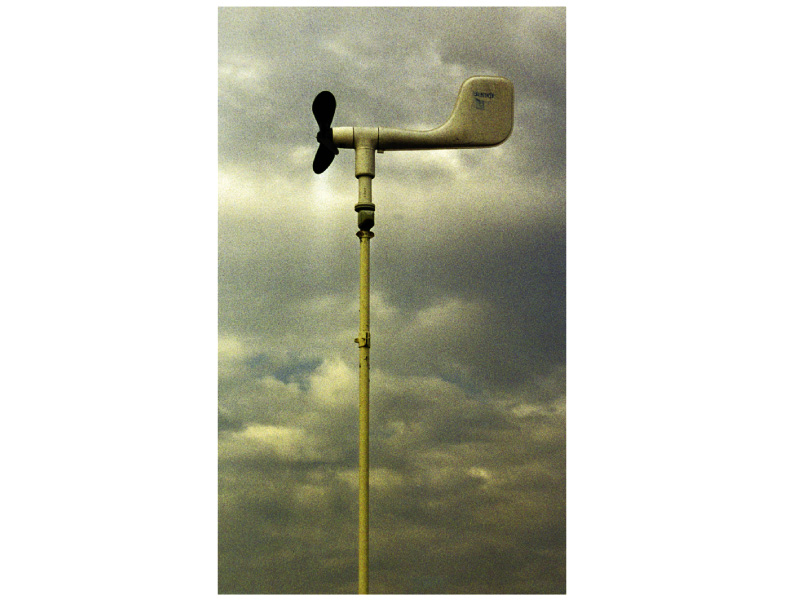
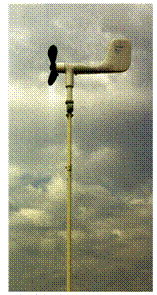
- Wind direction always indicates the direction from which wind blows.
- An anemometer indicates both wind speed and direction.
- Official measurements of wind at surface are made at an elevation of 10
meters, which is referred to as the anemometer height.
- Meteorologists typically measure wind speed in knots.
- è 1 knot =
1.15mph =0.51 m/sec
|
|
25
|
|
|
26
|
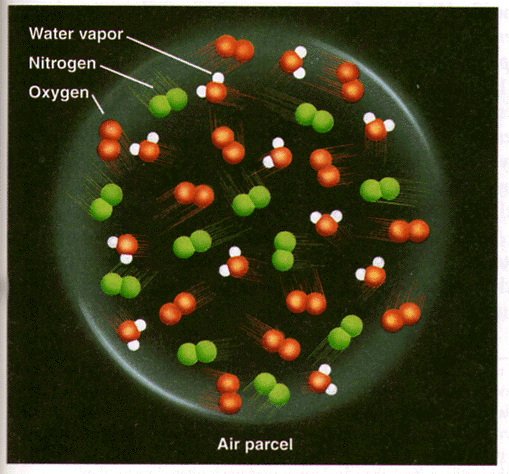
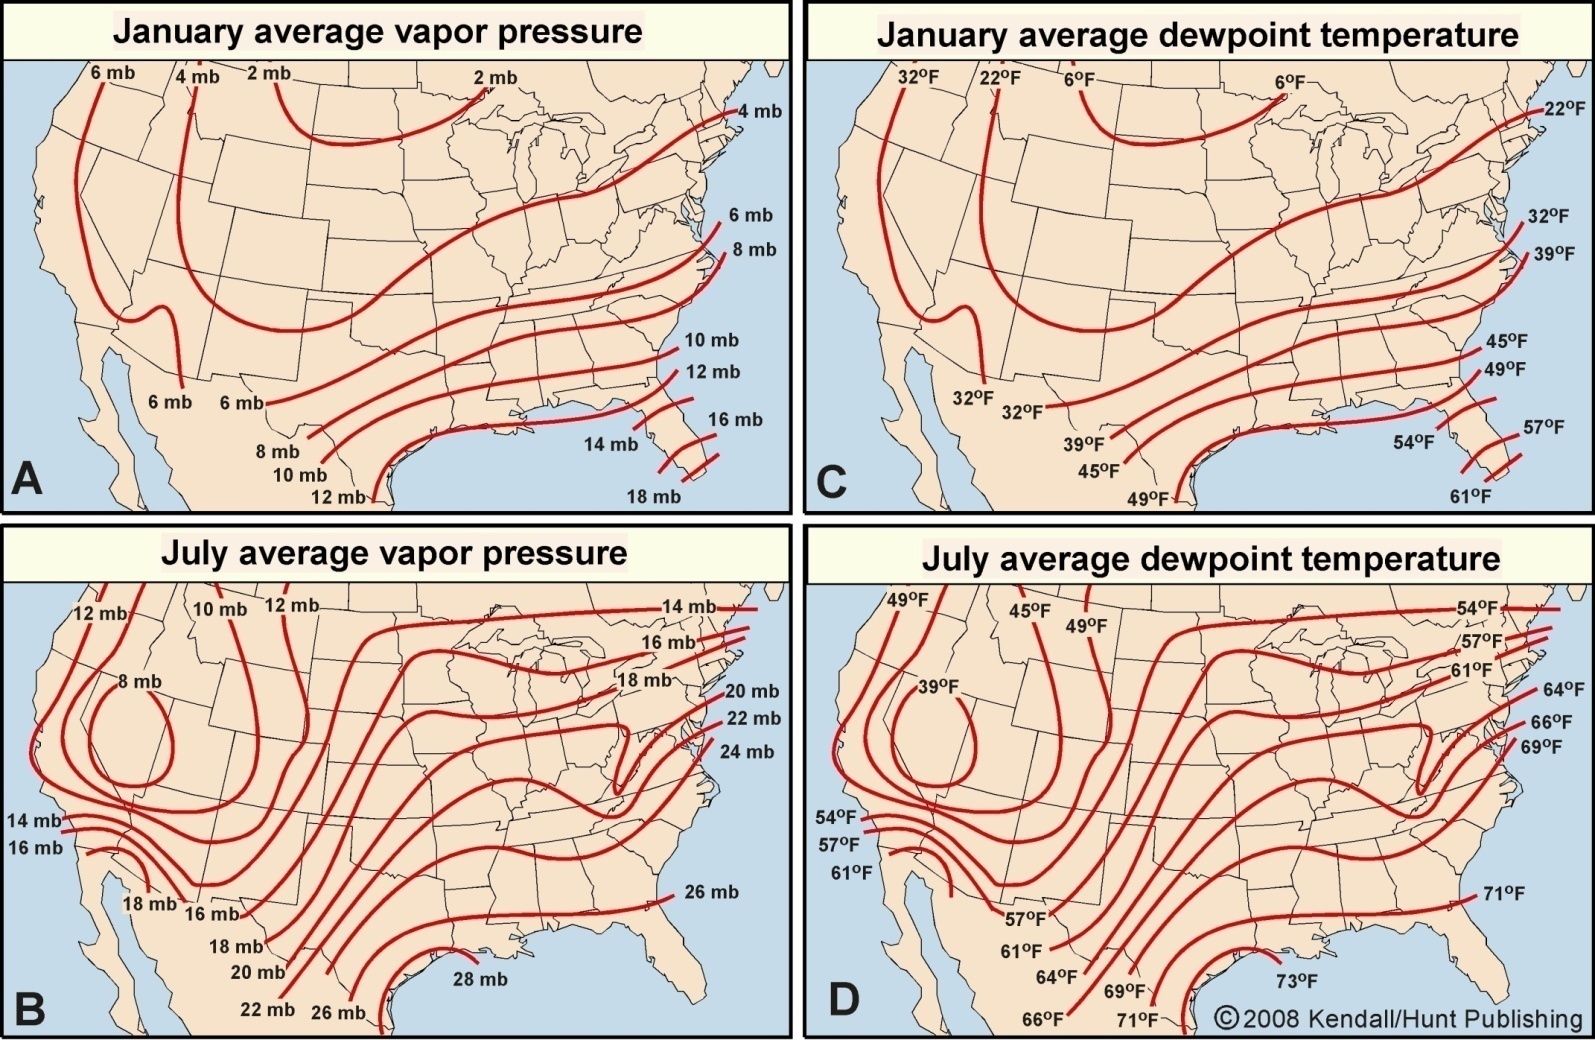
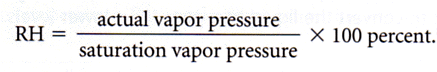
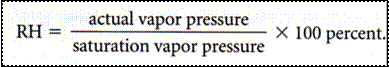
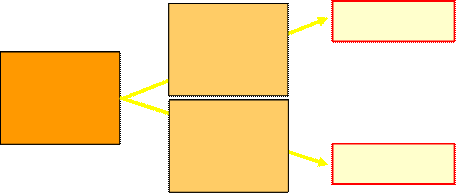
- The air’s content of moisture can
be measured by the pressure exerted by the water vapor in the air.
- The total pressure inside an air parcel is equal to the sum of pressures
of the individual gases.
- In the left figure, the total pressure of the air parcel is equal to sum
of vapor pressure plus the pressures exerted by Nitrogen and Oxygen.
- High vapor pressure indicates large numbers of water vapor molecules.
- Unit of vapor pressure is usually in mb.
|
|
27
|
|
|
28
|
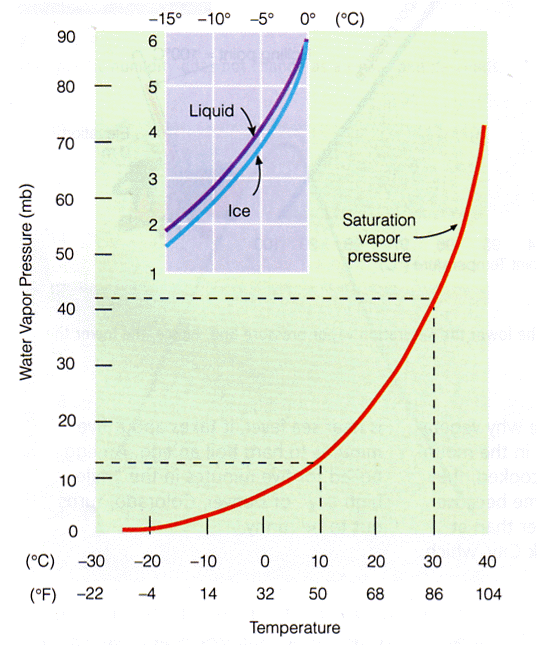
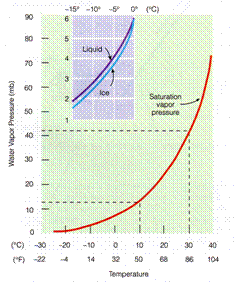
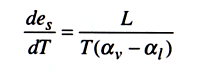
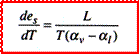
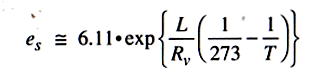
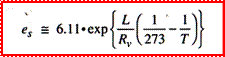
- Saturation vapor pressure describes how much water vapor is needed to
make the air saturated at any given temperature.
- Saturation vapor pressure depends primarily on the air temperature in
the following way:
- è
- Saturation pressure increases exponentially
with air temperature.
|
|
29
|
|
|
30
|
|
|
31
|
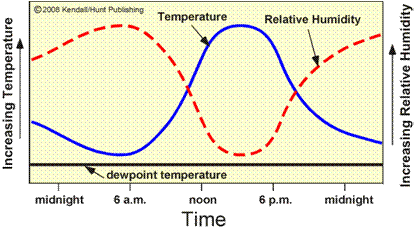
- Dew point temperature is another measurement of air moisture.
- Dew point temperature is defined as the temperature to which moist air
must be cool to become saturated without changing the pressure.
- The close the dew point temperature is to the air temperature, the
closer the air is to saturation.
- Dew points can be only equal or less than air temperatures.
|
|
32
|
|
|
33
|
|
|
34
|
|
|
35
|
|
|
36
|
|
|
37
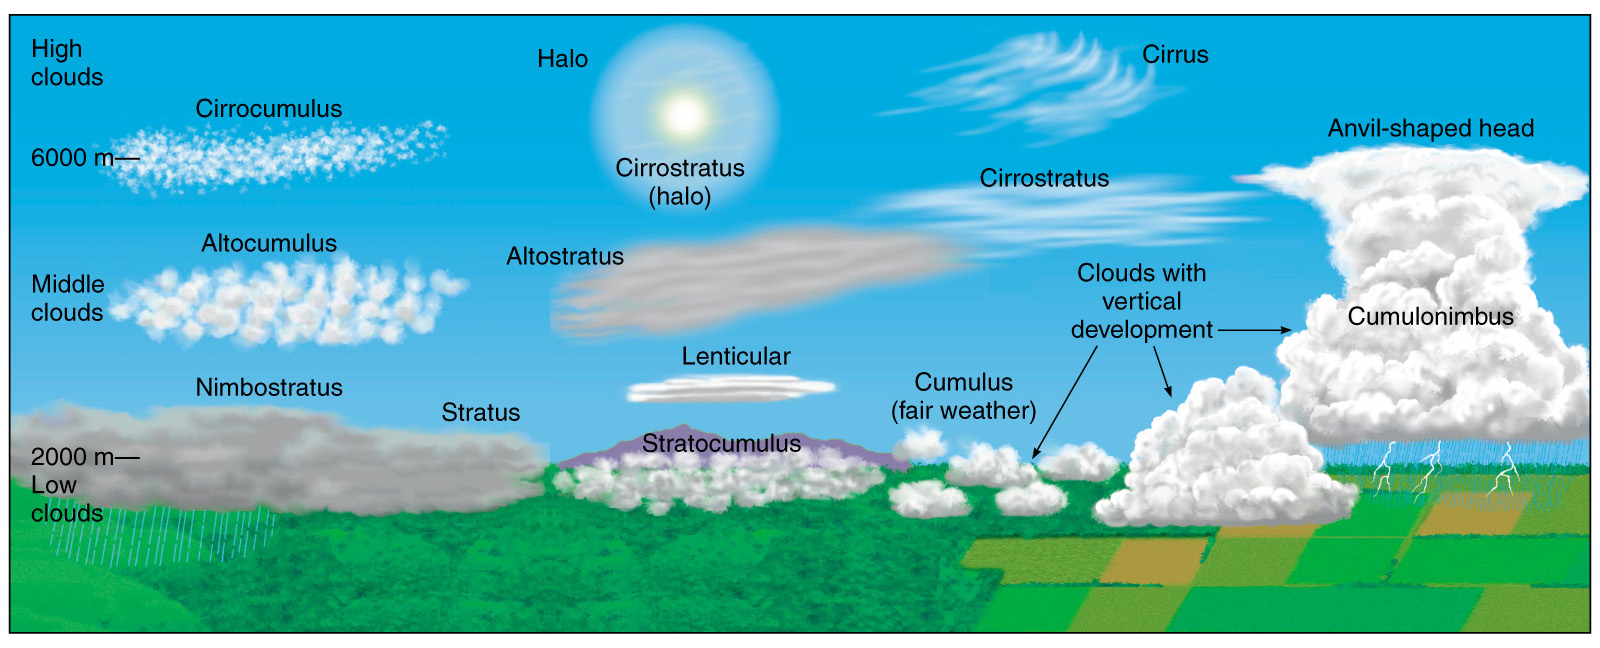
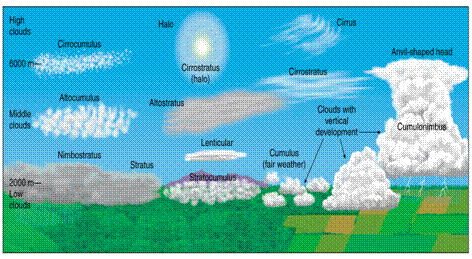
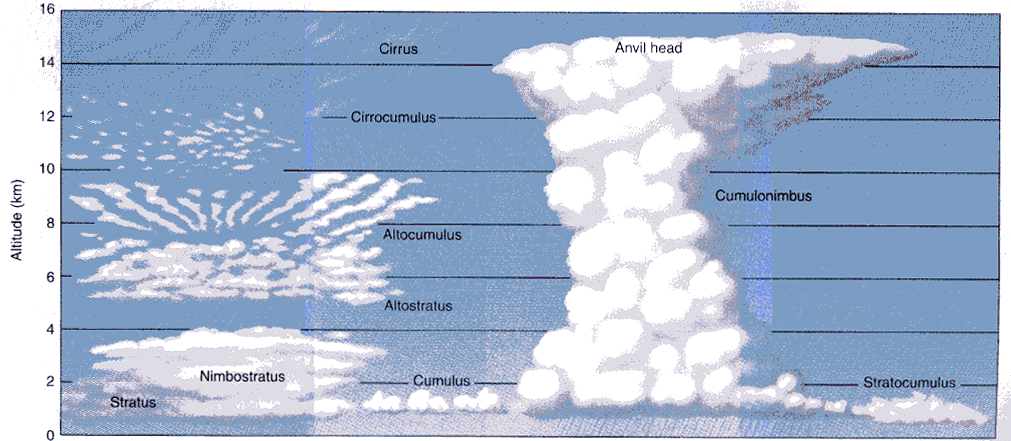
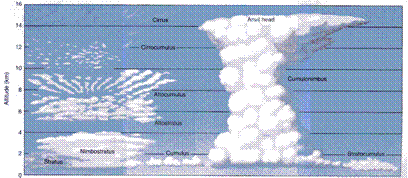
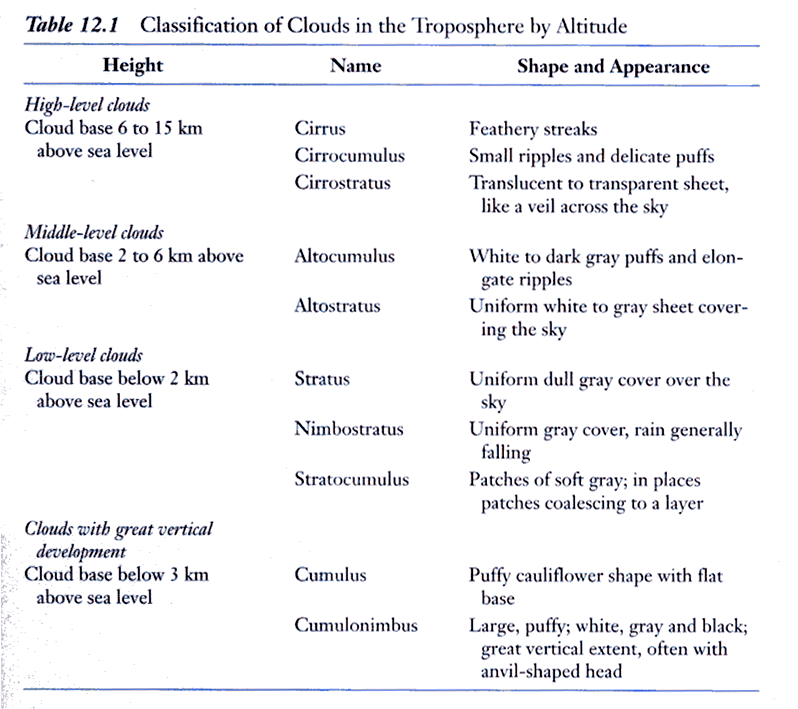
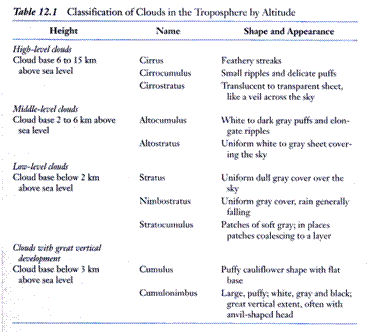
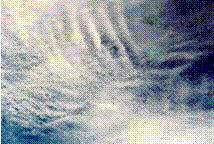
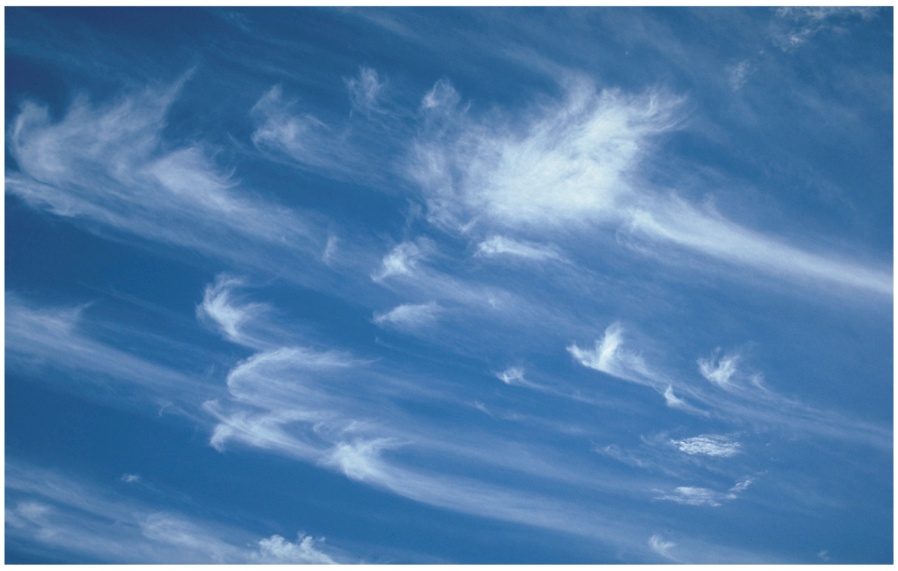
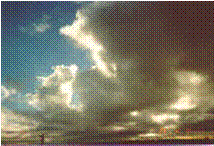
|
- High clouds have low cloud temperature and low water content and consist
most of ice crystal.
|
|
38
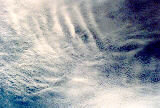
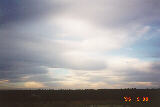
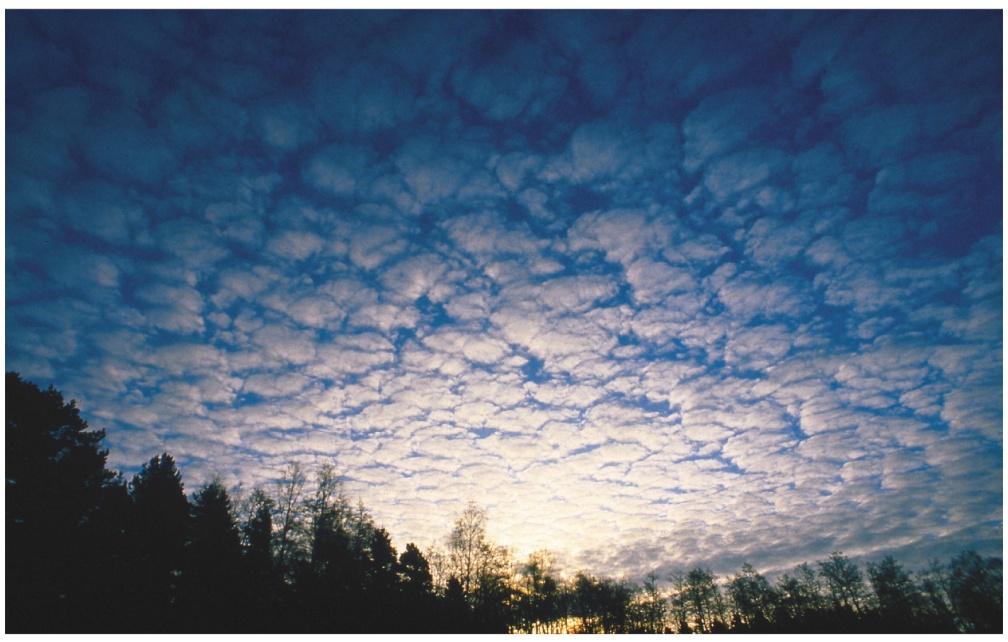
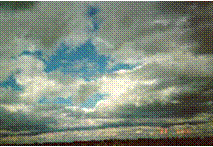
|
- Middle clouds are usually composite of liquid droplets.
- They block more sunlight to the surface than the high clouds.
|
|
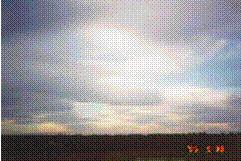
39
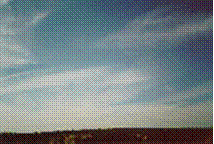
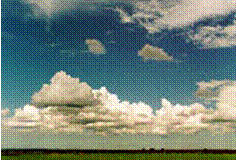
|
- Low, thick, layered clouds with large horizontal extends, which can
exceed that of several states.
|
|
40
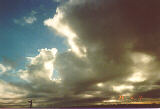
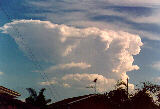
|
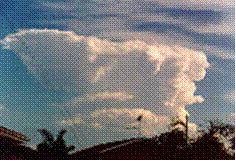
- They are clouds with substantial vertical development and occur when the
air is absolute or conditionally unstable.
|

 Notes
Notes