![]() :
A powerfull yet friendly programming language that can be used in almost every field.
:
A powerfull yet friendly programming language that can be used in almost every field.
# the hello world program in python
print('Hello World!')
![]() :
A powerfull yet friendly programming language that can be used in almost every field.
:
A powerfull yet friendly programming language that can be used in almost every field.
# the hello world program in python
print('Hello World!')
 NumPy
: The foundation of scientific python that brings to Python the high performance of scientific computation, as well as the MATLAB experience.
NumPy
: The foundation of scientific python that brings to Python the high performance of scientific computation, as well as the MATLAB experience.
import numpy as np
x = np.arange(0, 2*np.pi, 0.1)
y = np.sin(x)
 SciPy
:
Extends the power of NumPy with more tools, similar to MATLAB's toolboxes.
SciPy
:
Extends the power of NumPy with more tools, similar to MATLAB's toolboxes.
import numpy as np
from scipy.fftpack import fft, ifft
x = np.random.randn(100)
y = fft(x)
yinv = ifft(y)
 Matplotlib
:
Visualizes scientific data and produces publication quality figures, with a MATLAB-like interface.
Matplotlib
:
Visualizes scientific data and produces publication quality figures, with a MATLAB-like interface.
import numpy as np
import matplotlib.pyplot as plt

N = 50
x = np.random.rand(N)
y = np.random.rand(N)
colors = np.random.rand(N)
area = np.pi * (15 * np.random.rand(N))**2 # 0 to 15 point radiuses

plt.scatter(x, y, s=area, c=colors, alpha=0.5)
plt.show()

 Basemap
:
The matplotlib basemap toolkit is a library for plotting 2D data on maps in Python. It is similar in functionality to the matlab mapping toolbox, the IDL mapping facilities, GrADS, or the Generic Mapping Tools.
Basemap
:
The matplotlib basemap toolkit is a library for plotting 2D data on maps in Python. It is similar in functionality to the matlab mapping toolbox, the IDL mapping facilities, GrADS, or the Generic Mapping Tools.
from mpl_toolkits.basemap import Basemap
m = Basemap(projection='kav7',lon_0=0,resolution=None)
map.drawcoastlines(linewidth=0.25)
map.drawcountries(linewidth=0.25)
map.fillcontinents(color='coral',lake_color='aqua')

 IPython
:
Provides a rich architecture for interactive computing.
IPython
:
Provides a rich architecture for interactive computing.
 Jupyter
:
A web application for interactive data science and scientific computing.
Jupyter
:
A web application for interactive data science and scientific computing.
NetCDF4 : Python/numpy interface to the netCDF C library.
from netCDF4 import Dataset
ds = Dataset("test.nc", "w", format="NETCDF4")
print(ds)
H5py : Pythonic interface to the HDF5 binary data format.
import h5py
f = h5py.File('test.hdf5', 'w')
 Pandas
:
The art of data analysis, especially for time series and table data.
Pandas
:
The art of data analysis, especially for time series and table data.
import pandas as pd
s = pd.Series([1,3,5,np.nan,6,8])
dates = pd.date_range('20130101', periods=6)
df = pd.DataFrame(np.random.randn(6,4), index=dates, columns=list('ABCD'))
![]() Xarray :
Brings to NumPy N-D arrays the Pandas-like labeled axes, and the NetCDF-like but in memory data structure.
Xarray :
Brings to NumPy N-D arrays the Pandas-like labeled axes, and the NetCDF-like but in memory data structure.
import xarray as xr
ds = xr.open_dataset('test.nc')
 Dask :
Dask enables parallel computing through task scheduling and blocked algorithms.
Dask :
Dask enables parallel computing through task scheduling and blocked algorithms.
Bottleneck : Fast NumPy array functions written in Cython.
After Miniconda is installed, install the scientific Python packages using command conda install:
conda install numpy scipy matplotlib basemap ipython jupyter netcdf4 h5py pandas xarray dask bottleneck
You can also use conda install to install other python packages with similar syntax:
conda install PACKAGENAME
 Iris :
Implements a data model to create a data abstraction layer which isolates analysis and visualisation code from data format specifics.
Iris :
Implements a data model to create a data abstraction layer which isolates analysis and visualisation code from data format specifics.
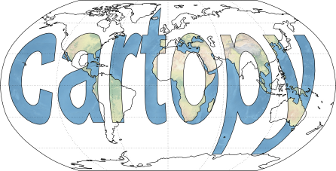 Cartopy :
Implements a data model to create a data abstraction layer which isolates analysis and visualisation code from data format specifics.
Cartopy :
Implements a data model to create a data abstraction layer which isolates analysis and visualisation code from data format specifics.
PyNGL and PyNIO : PyNGL (pronounced "pingle") is a Python language module used to visualize scientific data, with an emphasis on high quality 2D visualizations. PyNIO is a Python module used for reading and writing files in several different data formats, including netCDF, netCDF 4, GRIB1, GRIB2, HDF 4, HDF-EOS 2 and HDF-EOS5, and CCM history files.
Cdo : Allows you to use CDO in the context of Python and Ruby as if it would be a native library.
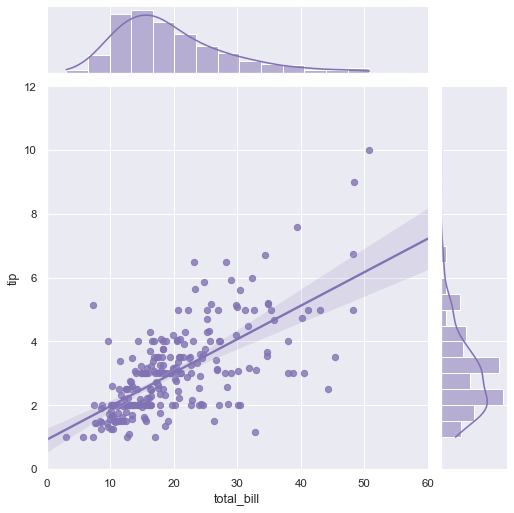
Seaborn : A Python visualization library based on matplotlib. It provides a high-level interface for drawing attractive statistical graphics.
import seaborn as sns
sns.set_style('darkgrid')
sns.set_context('talk')
g = sns.jointplot("total_bill", "tip", data=tips, kind="reg",xlim=(0, 60), ylim=(0, 12), color="r", size=7)
Numba : Makes Python run fast.
![]() Scikit-learn :
Machine Learning in Python.
Scikit-learn :
Machine Learning in Python.